
Corey’s new charting feature – color bars – work somewhat counter-intuitively; a green bar appearing now would be a short signal. – Ilene
SP500 Midweek Color Bars
Courtesy of Corey Rosenbloom at Afraid to Trade
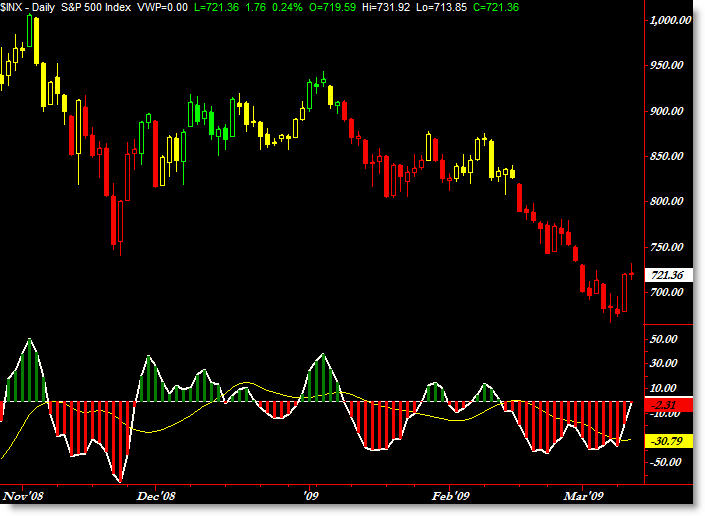
I wanted to introduce a new feature – that of “Color Bars” in our analysis. Let’s get started with a Daily look at the S&P 500 Index.
Let’s do a quick introduction to the color bars and their logic.
The bars are based on an Average True Range function (credit to LBR Group) where the color changes based on how far price has traveled off a price low (or high) in terms of a multiple of its Average True Range of the period.
Without giving away the formula, let’s say a stock is trading at $50.00 per share and its daily ATR value is $2.00. If a stock in a downtrend made a low at $50 then moved up $2.00, then the price moved up one ATR and the color would change perhaps to Yellow. If the stock moved up $4.00 – which would be two ATRs – off its price low at $50.00, then the color would then switch to Green.
While there’s a lot you can do with this, you’re mainly looking to classify price ’swings’ as a function of the average true range, where a large enough move will change the color – and thus the intensity – of a swing.
Bottom line, in a downtrend, you’re looking for green bars to confirm shorting opportunities. You’re also looking for red bars in an uptrend to confirm a buying opportunity – both retracement entries into an established trend.
You can see that the green bars in December and January – in the context of a downtrend – offered excellent shorting opportunities, as did the yellow bars in February – it’s a little counter-intuitive.
So this week’s move up hasn’t satisfied the criterion to ‘change colors’ or classify a swing yet – we’re still technically in a down-swing. We’d need to move up a little higher to change the color to be in an official retracement. It’s strange to say, but Tuesday’s big move up did not even move price one Average True Range off its lows.
Also, if you look at the 3/10 Oscillator, you’ll see we’re making an ever so slight Positive Momentum Divergence, which foreshadowed Tuesday’s rally to an extent.
It seems like there’s ‘open space’ above for price to retrace, though Wednesday’s doji close is not a strong bullish signal.
Keep watching price at these levels, as the expectation is for a move up as far as 800. It sure ‘feels’ like there’s more up to go, but if sellers step in here and push us to new lows (meaning this is all the retracement we can get), I’m afraid the bulls will just call it quits and we’ll get a capitulation move that could do some serious damage to investors.
Corey Rosenbloom
Afraid to Trade.com