
Corey Rosenbloom describes some positive action in the S&P 500.
Positive Sign from New High New Low Indicator
Courtesy of Corey Rosenbloom at Afraid to Trade.com
In looking under the hood a bit at the last few months on the S&P 500, we see an interesting sign of life – that of a three-swing positive divergence in the Net New Highs – Net New Lows Breadth Indicator. Let’s see it.
S&P 500 Daily:
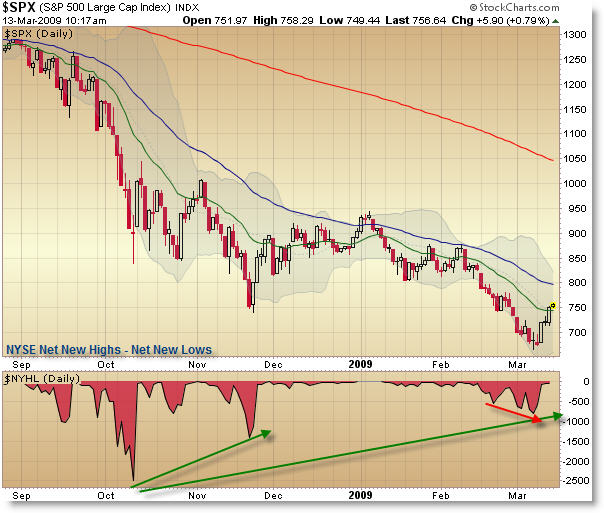
What the bottom indicator shows is the NYSE Net New Highs minus Net New Lows. On balance, we’re clearly under 0, meaning more new lows are being formed than new price highs (on securities that make up the NYSE index), which explains why price keeps making new lows.
However, if you look closely, you’ll see that the recent 665 price low on the S&P 500 (and Dow Jones) was made with fewer stocks making new lows than the previous two swing lows in October and November – this is potentially a sign of early strength (or at least an indication that fewer stocks are making new lows when compared to new highs).
It’s a little ‘under-the-hood’ metric that helps reveal broader participation, and it’s a good sign for the bulls to see this developing on the chart. We’d still like to see price get above the 20 and 50 EMA before getting bullish though, and particularly break the 800 level for confirmation.
It doesn’t necessarily mean we’re at a bottom (though it would hint that), but it means that there’s a little more going on in the market than blatant puking of shares at low prices.
Corey Rosenbloom
Afraid to Trade.com