
Here’s Corey’s latest Elliott Wave Count Update. – Ilene
Elliott Wave Update – Possible Count for March 26
Courtesy of Corey Rosenbloom at Afraid To Trade
(You’ll need to click for a larger chart)
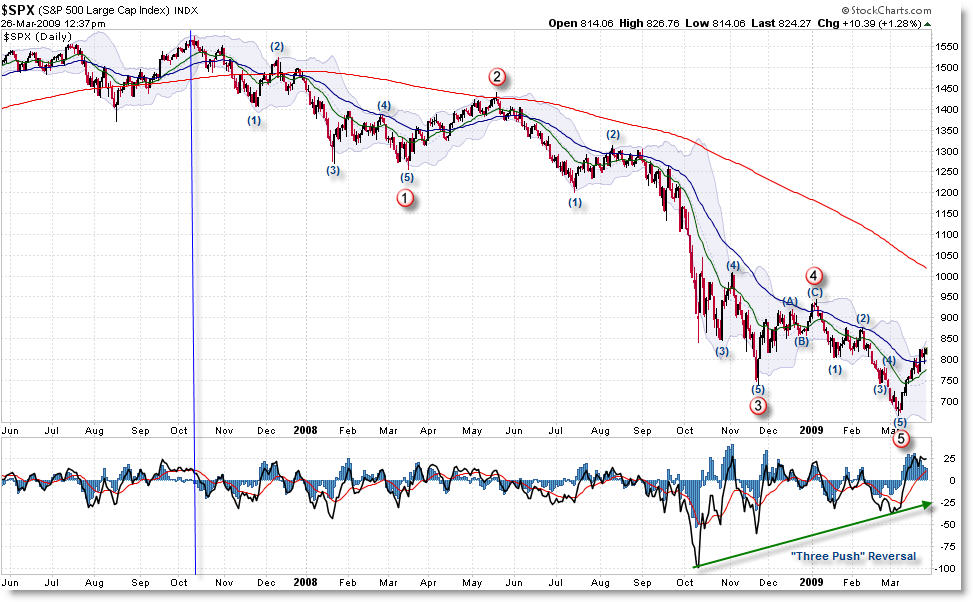
Let me first state that price breaking above 805 in the S&P ‘messed up’ the obvious count, which is that the current rally was a fractal Wave 4 of the final Wave (5) … or alternately of final 5 of Wave (3), but we’ll side-step that discussion for the moment.
According to one of only 3 basic Elliott Wave Rules (that’s right – as complicated as Elliott Theory is, it only has three hard rules)…
“Wave 4 Can Not Enter the Price Territory of Wave 1″
That’s why so many traders were watching the 800/805 level so intently on the S&P, and why it had so much trouble breaking above it, and that when it finally did break, we got a surge off that level because so many stop-losses (from the short sellers) were being covered.
 Because this happened, it forced Elliotticians to defer to their alternate counts. The count I have posted above is one of those alternate counts which implies that we achieved a full, five-wave count in the prior downswing from 950 to 665 on the S&P 500 Index.
IF this count is correct, it implies one of two things:
1) If we accept the count at face value, it would imply we have bottomed out here and that we are perhaps beginning a primary new impulse up – that is extremely hard to believe given the current negative economic environment, and that’s not necessarily an implication I’m willing to make right here.
2) If we assume that Primary Wave 3 has not yet completed, and that the down-move here just officially completed Wave 3, then we will be launching into a strong ABC (perhaps even Zig-Zag) Primary Wave 4 that could take us as high as 1,200 (but more realistically, 1,000/1,100). This ABC pattern could last months.
Let’s look at Scenario 2, which implies that we just completed (or are completing) Primary Wave 3:

I tend to lean more bullish at this time because other indicators hint at least an intermediate bottom is in place – for example, the lengthy positive momentum divergence, the “Three Push” Pattern, and the Government’s willingness to print money at will (which will perhaps catch up to us later… but not right now), and record low sentiment readings that came just prior to the absolute 665 low.
As much as it might ‘feel’ like we need to put in a final leg lower, that view may have officially changed with price breaking 805. Nothing’s to say we don’t come down and make new lows, but it just seems that the odds have shifted more bullishly for the time being. A solid break beneath 800 might challenge that assumption, but it just seems the winds are changing for whatever reason.
I’ll keep you posted with alternate scenarios and counts as needed and as more data (price) is revealed to us.