
Corey updates his analysis of the SP500 chart and contemplates whether or not 850 will hold. He sounds decisively undecided, but alert.
Will 850 Hold? SP500 Weekly Chart View
Courtesy of Corey Rosenbloom at Afraid to Trade
With the S&P 500 closing just shy of 850, will this level hold as resistance? A test of the 20 week EMA and negative volume divergence hint that it may.
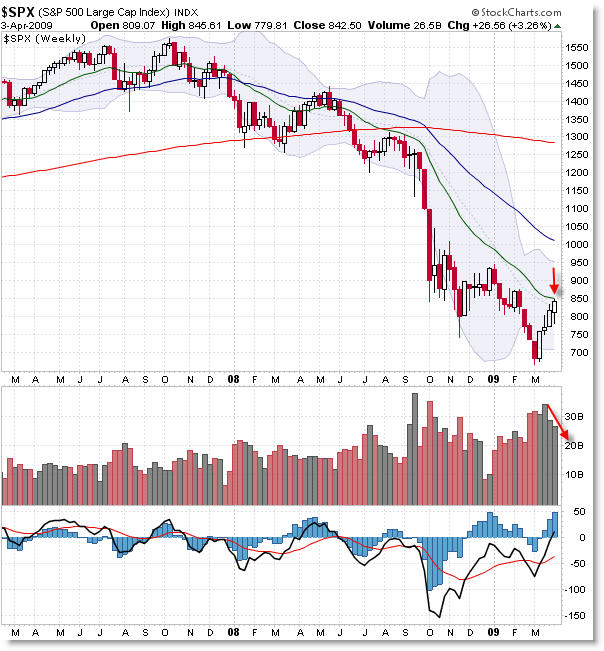
Keep in mind that the market has recently ‘blown through’ key resistance levels so who’s to say this one is any more important? But it does seem likely that bears might counter-check the recent bullish upside momentum with at least a downswing that could start at this level.
Back to basic Technical Analysis, price is in a confirmed downtrend, and the moving averages are in the most bearish orientation possible. Price has rallied up to test the falling 20 week EMA and we see a slight negative volume divergence (higher price on steadily lower volume) forming under the recent swing up.
We’re coming off a type of Three Swing Positive Momentum Divergence on the 3/10 Oscillator, so that hints that we might get a more powerful than expected rally, but divergences are often only good enough to forecast a short-term trade back to test the 20 EMA (on the timeframe in which it develops). If so, then we achieved this target on Friday’s close.
In the week ahead, let’s watch the 850 level closely for signs of weakness on the part of the bulls… and if bulls can push through this resistance, then a challenge of the 2009 highs from January (at 950) may be the next likely target, no matter how much the bears want this market to head lower.
Corey Rosenbloom
Afraid to Trade.com