
Corey explains the bullish signs he sees in the charts and sector performances. – Ilene
Sector Performance Year to Date as NASDAQ Turns Positive
Courtesy of Corey Rosenbloom at Afraid to Trade
Believe it or not, the NASDAQ Index made a fresh 2009 high on Thursday, making it the only major US Equity Index to do so. Let’s take a moment to view the NASDAQ’s daily chart and also how the major sectors have performed year-to-date.
NASDAQ Daily Chart:
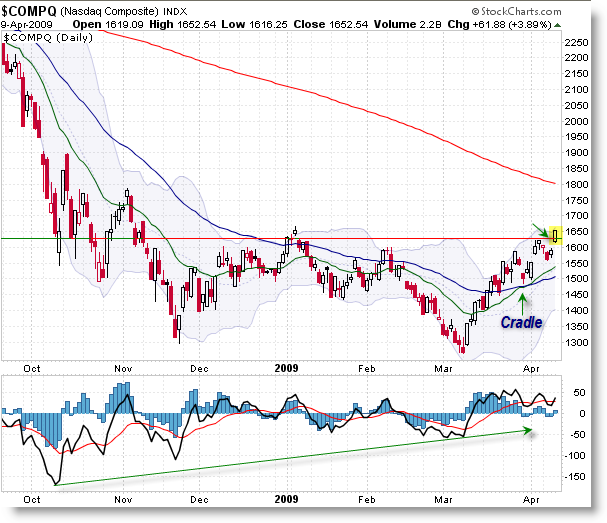
I showed in last night’s post the “Cradle Trade Buy Signal” in the S&P 500 Index. Look closely – while the Cradle formed on Thursday (April 9th’s) trading, the Cradle Crossover Buy Signal formed at the start of April in the NASDAQ, showing that the NASDAQ (structure) is leading the S&P 500. Generally, that’s a very bullish sign.
More importantly, the NASDAQ Index has ‘gone positive’ for the year, while the S&P 500 is down 5%, Dow Jones is down 8%, and Russell 200 is down 6.25%).
We see the same triple-swing positive momentum divergence as on the other indexes. Just a few more points to the upside will push the NASDAQ to a new high not seen since November 2008.
Let’s now see how each respective Sector has performed since the beginning of 2008:
AMEX Sector SPDR Year-to-Date Performance:

We are seeing strength in the ‘aggressive’ or ‘offensive’ sectors, namely Consumer Staples/Retail and Technology. Materials is also positive for the year. This is resoundingly bullish according to the Sector Rotation model – this chart is set-up to show the ‘flow’ of money through the economic cycle. It is also roughly divided into “offensive” and “defensive” sectors.
Notice that the Defensive Sectors (Consumer Staples, Health Care, and Utilities) are all negative on the year while the Offensive Sectors (excluding Financials of course) are positive – this is a theme that might fly under the radar for most people.
Continue looking ‘beneath the market’ to the specific sectors, and their relative strength and weakness to the S&P 500, to gain additional clues. For now, the money flow is quite bullish, as is the daily charts of the main US Stock Market indexes.
Corey Rosenbloom
Afraid to Trade.com