
Good news! and bad news!
House Price Crash Rate Finally Beginning To Ease
 Courtesy of Henry Blodget at ClusterStock
Good news! The rate of the price decline in the housing crash has finally begun to ease.
Bad news! Prices are still falling 18% year over year.
Specifically, in April, according to the Case Shiller index, the rate of decline in nationwide house prices eased slightly in April–to 18% from 19% in March. The rate of decline has hovered around 19%-20% for the last several months. And prices have now declined a staggering 33%-34% from the peak.
As we’ve noted over this period, before house prices can start recovering, they have to stop falling. And the first step toward prices stopping falling is a decline in the RATE at which they are falling. And we are finally beginning to see that.
But we’re still talking about an astonishing rate of collapse. And we’re still looking at a peak-to-trough decline of at least 40% and probably closer to 50% nationwide, which would be unprecedented. And even today, with prices down 33%-34% from the peak, prices are still above fair value.
So the folks who use this slight moderation in the rate of decline to spin tales of a "bottom" or, worse, a "recovery" are smoking something. Prices have at least another 10%-15% to fall, and they’ll likely be falling for at least another year or two.
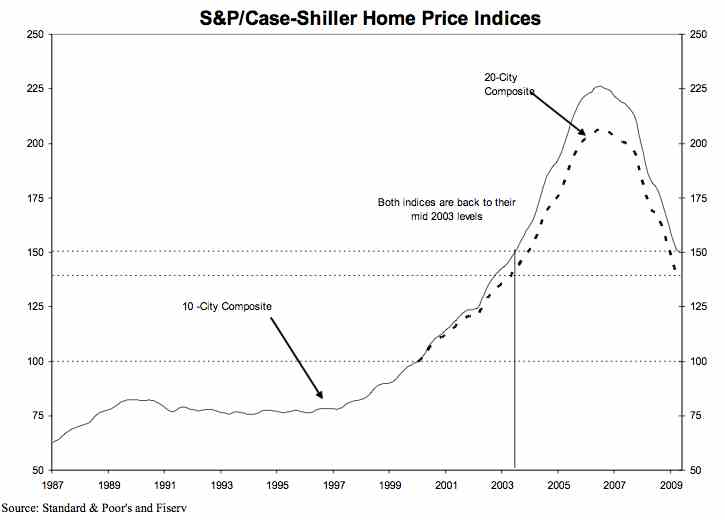
Here’s the small uptick in the rate of decline:

Prices have now rolled back to mid-2003 levels. They’ll likely be back to 2000 levels before we’re through.
And here’s the positive spin from the S&P press release (always look on the bright side!):
The 10-City and 20-City Composites declined 18.0% and 18.1%, respectively, in April compared to the same month in 2008. These are improvements over their returns reported for March, down 18.7% for both indices. For the past three months, the 10-City and 20-City Composites have recorded an improvement in annual returns. Record annual declines were reported for both indices with their respective January data, -19.4% for the 10-City Composite and 19.0% for the 20-City Composite.
“The pace of decline in residential real estate slowed in April,” says David M. Blitzer, Chairman of the Index Committee at Standard & Poor’s. “In addition to the 10-City and 20-City Composites, 13 of the 20 metro areas also saw improvement in their annual return compared to that of March. Furthermore, every metro area, except for Charlotte, recorded an improvement in monthly returns over March. While one month’s data cannot determine if a turnaround has begun; it seems that some stabilization may be appearing in some of the regions. We are entering the seasonally strong period in the housing market, so it will take some time to determine if a recovery is really here."
[Keep dreaming]
As of April 2009, average home prices across the United States are at similar levels to where they were in the middle of 2003. From the peak in the second quarter of 2006, the 10-City Composite is down 33.6% and the 20- City Composite is down 32.6%.
In terms of annual declines, the three worst performing MSAs continue to be the same three from the Sunbelt. Phoenix was down 35.3% in April, Las Vegas declined 32.2% and San Francisco fell 28.0%. Denver, Dallas and Boston continue to fare the best in terms of annual declines down 4.9%, 5.0% and 7.7%, respectively. Charlotte, Chicago, Cleveland, New York, Portland and Seattle posted record annual declines in April. For the month Dallas was the best performer returning +1.7%, while Las Vegas was the worst performer down 3.5%.
Looking at the data from relative peaks-through-April 2009, Dallas has suffered the least, down 9.6% from its peak in June 2007; while Phoenix is down 54.1% from its peak in June of 2006. Excluding Dallas, all of the 20 metro areas are in double digit declines from their peaks, with 10 of the MSAs posting declines of greater than 30% and two of those – Phoenix and Las Vegas – in excess of 50%.


