August Long Term Elliott Wave Update on SP500
Courtesy of Corey at Afraid to Trade
It’s time for the August Elliott Wave Count update on the S&P 500. I will show the two most plausible Elliott Wave Counts which remain unchanged from May’s Elliott Wave Update (which successfully targeted 1,000 as a minimum upside target in the S&P 500). Please review that post for deeper context as you read the August update.
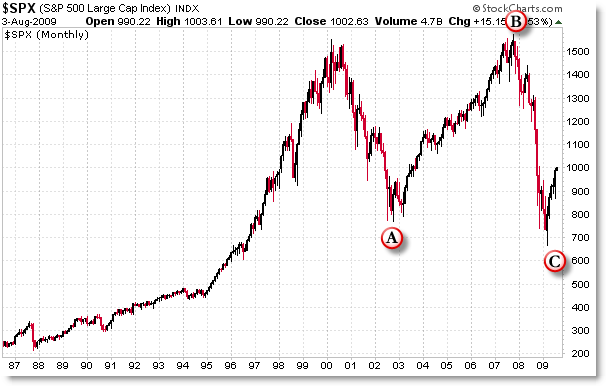
First, let’s take a look at the monthly structure:

The 2000 high was a major peak (most likely a large scale Wave III) and virtually all Elliotticians agree we are in a long-term (10 year) expanded flat (ABC) which is shown on the graph above.
Whether or not we have completed the “C” wave is up for interpretation as will be shown below, but this is the generally accepted “Larger Elliott Picture” in a simplified version for you.
Now, let’s revisit the “Most Bullish Scenario” as described in May’s post which WOULD assume that Cycle Wave C (circled) is complete and that we are in a new bull market:
As a disclaimer, I am not yet in agreement with this count, and this would be known as a ‘minority’ wave count that few in the Elliott Community have as their primary count. However, I like to consider charts from all angles and remove bias when possible, so I am presenting this as a possibility.
Without getting too technical, this count would assume that the required 5 “Primary” Waves of the Cycle C have all completed, and that we are now on the cusp of a Brand New Bull Market.
I noted that I am skeptical of this count because the 5th wave does not subdivide properly into 5 waves, and is shorter than the 1st wave which is unusual. That being said, Wave 5 did make a lower low than the 3rd wave, so this is most definitely a plausible count.
It would assume that Waves 1 and 2 of a fractal new Primary Wave 1 Up have formed and that we would be in a powerful third wave up here.
We will know this count is wrong if we make a new low beneath 666 in the near future, and will know that this count is correct if we have a powerful rally up from current levels or take out the 1,300 January lows within the next few months or into 2010. Those are the levels to watch to confirm this chart.
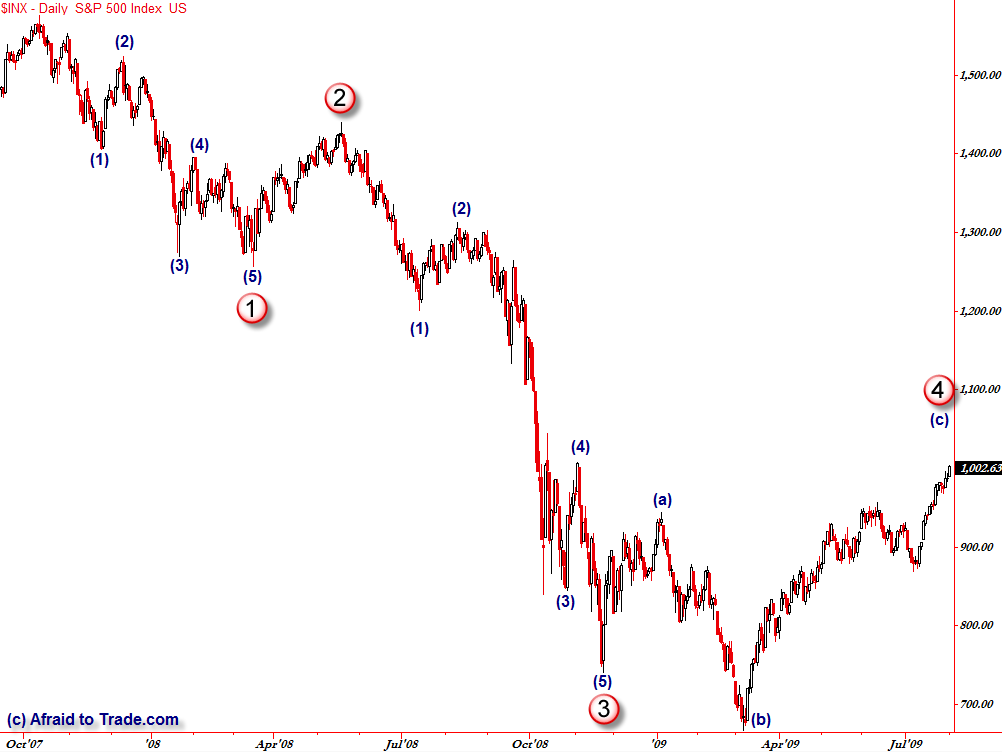
Next, let’s go to the generally accepted wave count, which is my primary count until proven otherwise:
I call this the ‘generally accepted’ count as it confirms more to expected Elliott rules, particularly with regard to the March lows and the potential expanded flat pattern that seems to have formed off the November 2008 lows, which called for a higher high to form on this recent “c” fractal rally – and it has.
I’ve long-since said that the target of this count was the 1,000 level or even as high as the 1,100 level but not much beyond that. We have arrived at those price projection targets in a rapid fashion, in a move that ‘looks’ corrective (which a 4th wave would be) but we would have to count this as a more ‘impulsive’ wave if price continues beyond the 1,100 area.
This count would be proven incorrect if we saw price rise above 1,300 any time soon, which would violate the principle “Wave 4 cannot enter the Price Territory of Wave 1.”
Furthermore, it would be confirmed as the dominant count if we saw a sharp swing to the downside within the next few weeks or even months (assuming price did not surge beyond 1,100 or 1,200) and price took out the 666 lows, which would be an initial downside target for this count.
The ultimate target would be a new low around the 600 or 550 level according to this count, but not a doomsday scenario far below that.
For those unfamiliar with Elliott Wave, it is one of many technical tools to help assess targets, market structure, and price possibilities and in no way is absolute (nothing is). It is most helpful from the standpoint of knowing what is NOT supposed to happen which can give signals.
It’s vital to have an open mind when applying Elliott counts, and know when alternate counts overlap in a given direction – which can be helpful as well.


