A Quick Look at the Monthly SP 500 Sept 19
Courtesy of Corey at Afraid to Trade
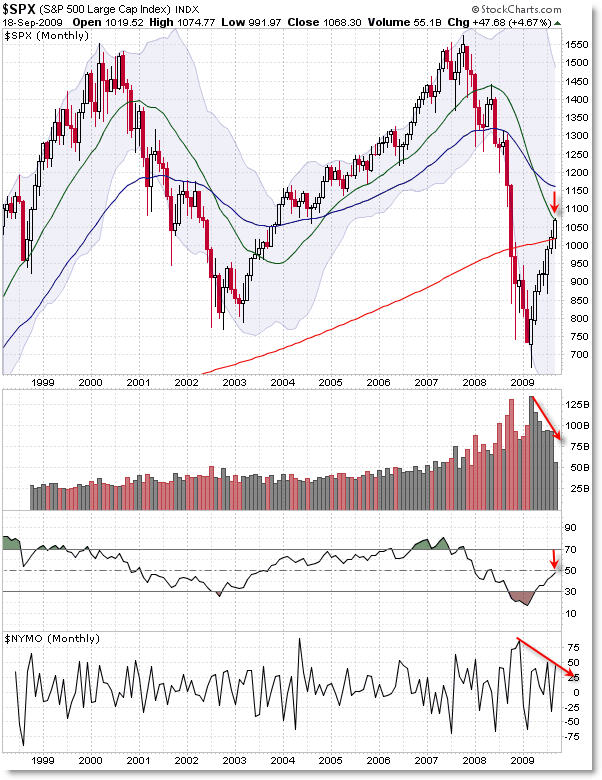
A reader brought this chart to my attention, and I wanted to show a version of the monthly S&P 500 Index with respect to the 20 month SMA, RSI Indicator, and McClellan Oscillator.

This is a deviation from what I normally show, but this time we’re looking at volume, the RSI Indicator, and NYSE McClellan Oscillator (a breadth oscillator) on the monthly frame.
Price has rallied upwards to the falling 20 month simple moving average (green) and has done so on falling volume virtually every month since the March 2009 lows.
The RSI – coming off of deeply oversold territory – rests just shy of the 50 level, which alone can provide resistance (at the half-way junction).
Finally, the NYSE McClellan Oscillator, as I mentioned in a previous post, is forming a divergence with price. The oscillator spike to 75 (closing basis), which was the highest level seen since the birth of the 2004 rally that led us to the 2007 highs.
Bursts up like this in the McClellan Oscillator are positive, and can underlie future strength… as we’ve seen off the late 2008/early 2009 burst to new highs.
The Oscillator is forming a distinct negative divergence with price as we’ve continued to rally – that’s a bearish non-confirmation.
As bulls have shown, there’s no guarantee these developments will lead to a down move, but it’s something the bulls certainly have to overcome to keep the market rallying.
Corey Rosenbloom, CMT
Afraid to Trade.com


