
Bear Market Rallies and Lessons of History
Courtesy of John Lounsbury writing at Seeking Alpha
John’s blog: Piedmonthudson’s Weblog
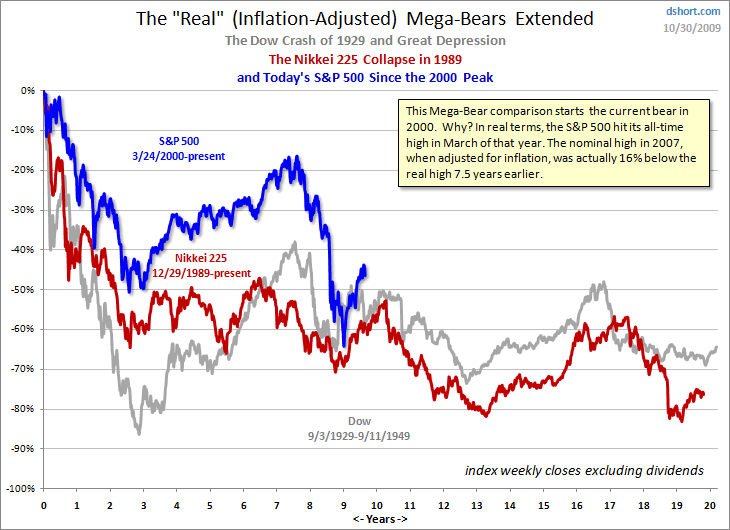
Many have tried to draw comparisons between the current market patterns and some notable past market experiences. None is better at doing this graphically than Doug Short (dshort.com). Here is his comparison of the current market (using the S&P 500) and two other famous (and catastrophic) bear markets.
Repeating History?
Doug’s chart begs the question of whether his comparisons can be ignored. It can be argued that our financial system "solutions" are following too closely the Japanese model and that could lead us to another lost decade in the twenty-teens.
However, there are a number of differences. For one thing, we are early in the resolution of this financial crisis and can still do the right thing by forcing the most egregiously over levered behemoths to restructure into viable concerns. We also still have the possibility of forcing all the "too big to fail" to break up into a larger number of concerns "too small to destroy us". We have not passed the point of no return in this regard. We may still be able to reestablish some semblance of a financial free market. Look at what happened in the twenty years after AT&T was forced to break up. Would the information age and the internet have developed as quickly in a less competitive environment?
A second point of difference between the U.S. and Japan is demographic. Japan has a ratio of elderly to youth far larger than we have now or are projected to have in the twenty-first century.
As Simon Johnson pointed out (here), recovery…
"…remains fragile in the United States because of problems in our financial sector. While our situation today is quite different in key regards from that of Japan in the 1990s, the Japanese experience strongly suggests that fiscal stimulus is not an effective substitute for confronting financial sector problems (e.g., lack of capital, distorted incentives, skewed power structure) head on."
It is not impossible for the U.S. markets to have a second lost decade like Japan, but there are many ways that it can be avoided.
The second comparison Doug makes is to the 1929-49 U.S. market. There are so many differences in the economic system today from the 1930s that a close retracement should be unlikely.
However, an echo is possible in the form of a long protracted period of poor economic and stock market performance without going to utter collapse as in the early 1930s. We may have seen the market bottom for this generation on March 9 (or not), but, either way, the possibility that we don’t see 14,100 on the Dow again for another 5-10 years is a real possibility.
Volatile Markets
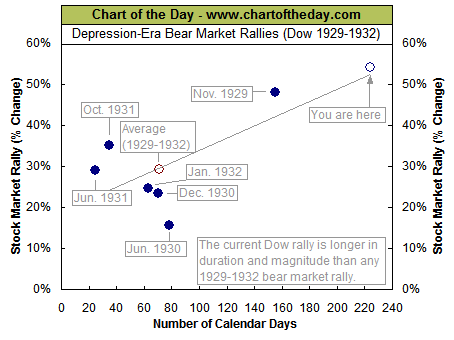
From Chart of the Day comes this comparative chart. The current rally is outside the box defined by rallies in the market collapse from 1929 to 1932. It is both larger and longer. The only point that deep collapse bears can hang their hat on is the fact that the closest point on the graph is the initial counter trend rally of the super cycle bear market. They can proclaim that this is just the first of many counter trend rallies.
My personal opinion, mentioned previously, is that we will not repeat the 1929-32 debacle, but we are also not going to be off to the races into a new bull market. I give less than 50% probability to taking out the March 9 lows, but greater than 50% probability that we could give back half of the gain in this rally. That would give us low for the Dow in the vicinity of 8,300 to 8,500 within the next six months.
I base my estimate on two things plus a lot of "Kentucky windage":
- A 50% retracement of the rally from March 9 would put the Dow around 8,300.
- Using the S&P earnings estimates (here) and a target PE of 16, the low for the next 6 months for the S&P 500 would be about 850, which corresponds to Dow 8,000.
Of course, this is based on a muddle through recovery without the robust economic activity that would cause the S&P earnings estimates to be too low. On the other hand, the projection of the next cyclic low is too high if we double dip into a recession of any severity.
Hat tip to Options Girl for her question that lead me to include this discussion.
What Really Was Unique About the Crash of 1929-32?
A comment from Andrew Butter has caused me to realize that the presentation of the chart above as provided by Chart of the Day does not provide focus to the reader of what I saw when I first looked at it. Below I have posted a mark up of the chart.
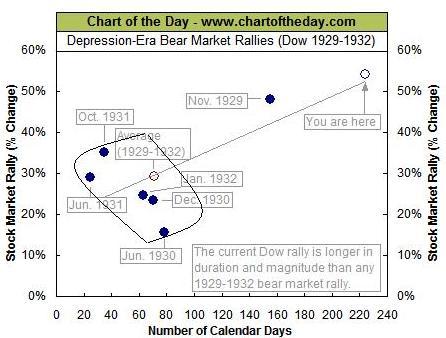
The box that has been added contains four of the seven primary bull rallies that have occurred within a time span of 100 days from bottom to top in the last 110 years. (Actually, all bulls ran for 68 days or less; there never has been a primary bull that had a duration between 69 and 104 trading days.) The fifth point displayed (June 1930) gained less than the 20.0% threshold I define to constitute a primary rally.
The seven very short lived primary bull moves are listed below:
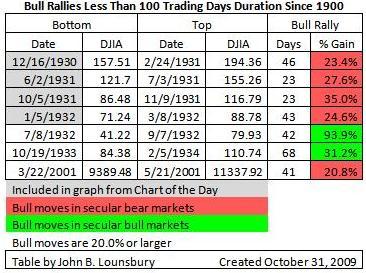
All of the daily Dow data from 1900 was analyzed in a series of articles last year. The data in the table above was taken from here.
A list of observations:
- Of the seven very short market moves up of 20% or more in the last 110 years, four occurred during the collapse from 1929 to 1932.
- Two more were among the first three rallies from the ultimate bottom in 1932.
- The rally in between the two "greenies" above was also short, lasting only 138 days.
- The seventh "shortie" occurred in a false rally on the way to the 10/9/2002 bottom following the 1/14/2000 top.
Since 1900, all very short primary rallies have occurred in markets that have still further to fall, or in rallies immediately following 100-year bottoms.
The Lesson
Whether or not the March 9 low is an intermediate low on the way to an ultimate bottom or constitutes the latest "100-year low", we have every reason to expect higher than normal volatility going forward. That is the lesson of history.