
The Long View
Courtesy of Binve at Market Thoughts and Analysis
I am short term trader, long term trader and investor. From a short term perspective, I put up lots of posts with charts about the current waves. Because they are immediate and most people follow the short term market action. But I do short term trading with only a portion of my portfolio. I am as much or more focused on the long term, the next 5-15 years out. And as the long term market trends move slowly, there is no need for me to write several posts about them a month.
But we are nearing a critical juncture. I believe the cyclical bull market (the bear market rally since March) is winding down. And the larger secular bear market will resume it hold. When will this occur? I think very early in the New Year (2010). But this post isn’t going to be about the technical analysis or EW counts of the small Minor Degree waves leading up to that juncture. I am going to talk about the big picture. And the big picture moves in "approximates" or "windows of opportunity" not exact dates. But I think we are close enough to the top so that those who are seriously bullish on the market should consider taking some profits, or those who are seriously bearish on the market (and I am) should consider getting positioned in some long term shorts (or adding to shorts you established at the top in 2007).
Format
I will be borrowing heavily from two large macroeconomic posts that I have written in the past:
– The Long View – Aug 27, 2009
– Still Bearish: FA and TA on S&P 500, Observations on the Economy – May 10, 2009
Why?
Because very little has fundamentally changed since then. Things are not only structurally as bad as they were in March, they have gotten worse. All of the things that Ben Bernanke was recognized for in his Time Person of the Year award, is making the problems worse and postponing them (see Peter Schiff’s latest video blog, courtesy of kdakota for some good analysis on this: Peter Schiff Video Blog – December 17, 2009 (Person of the Year)). From a scheduling point of view, the ramifications of these problems have been moved to the right.
The rally off the bottom in March was not unexpected. I played from the long side very near the bottom. But the duration and strength of the rally has surprised me and many of the bears. And it is because of the policy decisions that were made, that were so reckless, it surprised even the most bearish. The Fed and Treasury succeeded in engendering enough confidence, and pumping enough liquidity, to sustain a very spectacular rally. But like I said above, all the problems were simply moved to the right. And the market is starting to realize that the time to deal with them is soon.
Fundamentals
There are still so many long term issues that have not been dealt with. The economy is still structurally the same (70% consumer spending) and besides a lot of optimistic rhetoric, none of the problems that got us into this mess have been fixed. There have been a lot of band-aids applied. And even to an open festering wound a band-aid will apply some "relative" amount of relief (vs. doing nothing) in the *very short term*. But if you have a severed carotid artery and you put on a band-aid, it will soak up excess blood for a couple of seconds, before that band-aid becomes saturated and is no longer effective. The stimulus has stopped the free fall in a number of economics indicator "bleed-outs", but have they "fixed" anything? And the "it can’t get any worse" defense is not valid. Because it can, and I believe it will.
Earnings and Valuations
The P/E Analysis section is excerpted from my post: Sentiment: P/E, BPSPX, VIX and CPC – Oct 4, 2009
I posit that P/E is as much a sentiment tool as it is an objective valuation tool. And it is too high currently (as it was back in March) for a meaningful bottom.
To explain why, let’s think about what P/E means. It is the the "payback period" for a stock’s current earnings to justify/cover the current share price. Another way to look at it is the *premium* that you place on the stock’s ability to generate future earnings. Earnings theoretically grow for growing companies, or they are stable and consistent for well-run companies. But shouldn’t a P/E for a particular company or even a sector be a well-known and consistent metric? Why would anybody pay a premium on P/E beyond the historical average P/E?
Because investors are emotional. They fall prey to greed and fear, optimism and pessimism.
Moreover, large scale herd-behavior for optimism and pessimism actually runs in cycles. Read this article, it is a fantastic description of this valuation cycle: http://www.zealllc.com/2007/longwave3.htm. The main upshot of the article is that these long valuation waves take about 32-36 years to run, the last bottom was in 1981, and valuation bottoms do not occur until the broad market (as measured by P/E’s on the Dow or the S&P 500, which have very similar P/Es most the time) P/E is between 6-10. Long Term (100 year) average P/E is ~14.
So lets see what the data is saying for the S&P 500. All of the data shown is taken directly from Standard and Poors: http://www2.standardandpoors.com/spf/xls/index/SP500EPSEST.XLS
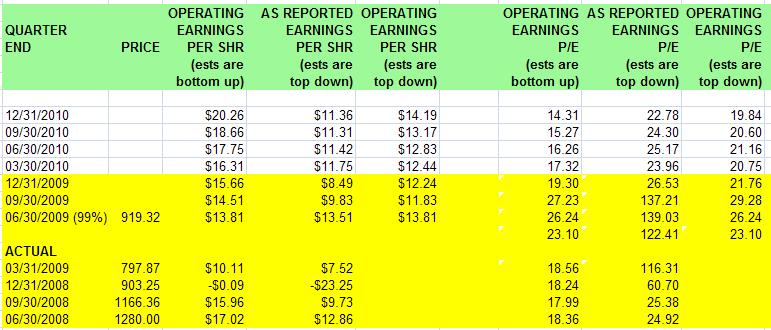
Furthermore, P/Es can be reported against actual GAAP earnings or Operating earnings. There are pros and cons to both approaches but always be aware of both metrics.
So looking back at March 09, 2009 (SPX @ $666) right before earnings season. Let’s use Twelve Month Trailing earnings for March 31, 2009. TTM actual earnings were $6.86 which gives a P/E of 97.1!!! TTM operating earnings were $43.00 which gives a P/E of 15.5. So in actual terms, P/E was still nearly triple digits. But even in operating terms, the P/E was still above the long term average and nowhere near 6-10. …. Doesn’t seem like a P/E bottom to me.
Now, lets go to Sept 23, SPX @ 1080. TTM actual earnings are $7.51 => P/E of 143.8!!!. TTM operating earnings are $39.79 => P/E of 27.1!!
… are you kidding me?
Okay, lets give the "analysts" the benefit of the doubt. Lets use Q409 TTM earnings (again based on analyst estimates, which are arguably very pollyannaish) which gets past the negative earnings quarter from Q408. TTM earnings estimates are $39.35. and lets use the SPX high of 1080 for a comparison. => P/E of 27.5!!. Okay, lets go to operating estimates. TTM op est are $54.09 => P/E of 20.0!!
…. again, I ask what is this market smoking?
I have shown that P/E’s did not once during the crisis reach anything approaching a bear market valuation bottom when compared against the historical record. And I am showing now that even for end of year estimates, from S&P itself!, (which most agree are *very* optimistic) the P/E is still vastly greater than the long term historical average and still in bubble territory.
Which brings me back to P/E as a sentiment indicator.
People right now are buying the hype. They buy the upgrades from Wall St. analysts. They buy the "turned the corner" rhetoric from economists. Nobody seems to remember this from the 2007 top or the 2000 top. SENTIMENT and RHETORIC is always extremely optimistic at the top! So they go back to the default "this time its different" mentality, buy the hype and pay the premium on the market with respect to valuation.
Changes happen at sentiment extremes. And I think the social mood with respect to the broad market valuation has much … *MUCH* further to fall.
Additionally inflation arguments for P/E are also invalid. Because P/E is "inflation neutral" (Prices are inflated and Earnings are inflated, so P divided by E removes inflation effects).
Option-ARMs and Rising Mortgage Delinquency Rates
Here is a 60-minutes piece (exceptionally informational and well done) on the upcoming Option ARM wave. If you have not watched this, please do so here . Actually, even if you have watched it, watch it again. This is a BIG DEAL.
The second wave of the mortgage meltdown has not yet hit, and we are just at the very beginning of the second wave. Check out the chart at 3:48 of the video above. Now couple this with the unemployment observations I have made above. When these mortgages all reset to higher rates, do you think that the economy will escape from the huge number of default rates, especially from the newly unemployed? Do you have any clue what this will do to consumer spending for people that can now just barely afford their mortgage? Do you honestly believe that we can refinance our way out of this mess (which would just further push the problem out instead of fixing it, despite that fact that this won’t work to begin with).
Then after option ARMs, people are starting to default on regular mortgages. Not subprimes, not teasers, but good old 30 year fixed delinquency rates are going up. And very few people are talking about that too. It is a small trend now, but growing. And in a society where there is a lot of home ownership and rising unemployment, mortgage exposure is a liability. Financials still have **huge** mortgage exposures and the consumer outlook is not good. Which makes mortgage exposure even more risky in the future.
Economic Outlook
Why we are in a long term “secular” bear market.
I have discussed this in many places and have remarked on this in many blog posts. I will refer you to this post for the majority / fleshing out of my argument Still Bearish: FA and TA on S&P500, Observations on the Economy May 10, 09 – LINK.
But let me summarize briefly here:
– Consumer spending makes up 70% of GDP
– Consumer is getting squeezed
– Consumer is spending less
– Consumer, despite spending less, are still losing their jobs
– Unemployment is rising (despite pauses / minor corrections in the rate)
– Consumer are therefore defaulting on mortgages
– Much mortgage debt has been “monetized” by the Fed via the bailout / takeover of Fannie and Freddie
– However a brand spanking new wave of mortgage defaults are occurring – Option ARM resets
– There is still so much bad debt hanging over the economy and much of it will be either defaulted upon or monetized (and despite what the Fed or Keynesians tell you, is not a significantly “better” option)
– Monetization has been an overused band-aid, and is now saturated with the dripping puss from the economy (sorry to be so graphic). The is done to avoid short term pain, but is destroying the value of the US Dollar
– A currency crisis in the Dollar is almost inevitable at this point
– Look at the Treasury market for a clue. During the deleveraging crisis in 2007-2008, safety was sought in Treasuries, now at bubble proportions. Since the subsequent Quantitative Easing (fancy / almost misleading term for monetization) and the value of the Dollar has been further depreciated, will Treasuries continue to be the save haven during the next crisis?
– Going back the consumer for a minute: consumers spend less which hurt business, but also the government
– Tax Revenues are Down
– Municipalities and States are insolvent and on the verge of bankruptcy
– What will happen: Denial of Services (social unrest) or will they get bailed out by the Fed and Treasury (further monetization of debt)
– GDP: The biggest growth sector is … the government
– The government does not have a wealth, all it has are claims on future tax revenue of US citizens and debt that it can sell to foreign governments (more in a minute)
– So when the government grows it is not growing the GDP truly. Any effect is temporary because it is paying for it through deficit spending or dollar devaluation (or both)
– Which mean in real terms (in devalued / inflation-adjusted dollars) GDP is severely contracting.
– China is not growing as strongly or as sustainably as many suggest: Steve Saville: Getting Some Things Straight Regarding China
– If China continues of the path of holding the yuan fixed relative to the dollar, it will have it is own inflation nightmare to begin with (read article above for explanation)
– China will likely need to stop purchasing new US Treasury debt at the levels they used to (it is unclear what they will do with their current US holdings, but they have already begun rotating into commodities)
– This means the Fed will have to continue to step up buying US Treasury debt (to keep interest rates low so that we can “borrow our way out of this mess”).
– This further debt monetization further undermines the dollar, and furthers the likelihood of a currency crisis in the dollar.
– Businesses are by and large NOT doing well
– The past 2 quarters have seen earning growth relative to the previous quarter.
– Revenues for leading companies have grown slightly (relative to previous quarter), but across the board, they are mostly flat or down
– Compared to a year ago, earnings and revenues are in the toilet.
I could go on and on. But you get the picture. The outlook for any “true” GDP growth (that is growth that is not driven by government spending) is bleak due to all the points made above.
The problem, as you have surmised, is debt. There is simply too much of it. At the core, this is the issue that must be dealt with.
Sentiment
So we have a disconnect right now on several fronts:
– Economists are declaring the recession is over
– Politicians are pointing to "green shoots" as proof that the stimulus "worked" ("working" being sustainable economic growth vs. a temporary economic sugar rush)
– All of the observations I made above are still valid, there is still long term risk that has absolutely not been mitigated in the last 6 months
You could view my example above, Ben Bernanke becoming Time’s Person of the Year, as an indicator that bullish sentiment is at a zenith. "Everything is fixed, we can all relax and breathe a sigh of relief. Time to start handing out the kudos".
Let me offer up another thought. Sometimes the Truest Points are Made Through Humor
This is one of my all-time favorite Saturday Night Live sketches — Global Century Investments: Straight Talk About Today’s Market. It was aired back in 2003. I think it is worth watching again now because
a) It’s funny
b) The fundamental bulls who are jumping into this market now on the long side will become the bagholders
These are a few lines from the video that while told humorously as satire, are sharply true:
Peter Burke: The market goes up, the market goes down. But, over the long haul, the market goes up. [ a hand is raised ] Yes?
Investor #4: Is there any chance the stocks might rebound this year?
Peter Burke: I’m really the wrong guy to ask. I got completely out of stocks in late ’99, and I haven’t followed the market since.
Investor #5: You got out of the market three years ago?
Peter Burke: Yes. You see.. around that time, we at Global Century became convinced that stocks were headed for a crash, and that bonds were the safer bet. And, we were right. My own bond portfolio is up nearly 30%.
Investor #5: But, if you were moving out of stocks and into bonds three years ago, why were your brokers telling people like me to do the exact opposite.
Peter Burke: Well, obviously, if you think, as we did, that stocks are heading down, and you want to unload them before a crash, you have to convince somebody out there to buy them. That’s just common sense. [ a hand is raised ] Yes?
So a question to all of the bulls:
Why are Wall Street analysts and brokers upgrading everything that can be traded after the market has gained 60% in just 8 months?
Read the highlighted line above: Well, obviously, if you think, as we did, that stocks are heading down, and you want to unload them before a crash, you have to convince somebody out there to buy them. That’s just common sense.
Definitely watch the video. It is worth 2 minutes of your time.
But the point of this is to show that stocks climb a Wall of Worry. But we are past that. Everybody is bullish. Investors Intelligence just had the most bullish investor sentiment readings in almost 3 years. Wall Street is slapping each other on the back. Economists are getting accolades. Mutual fund cash levels are near record lows. Everybody is bullish!
So if stocks climb a Wall of Worry, then they fall down a Slope of Hope. Be greedy when others are fearful and fearful when others are greedy.
That doesn’t mean that "we reached the magic sentiment level and the drop immediately commences". I am not forecasting a crash tomorrow. But what I am saying is that the environment is ripe for a change. This is not the only necessary ingredient, but it is a key ingredient.
The VIX has become very complacent recently. But it bottomed into a large support zone is hovering right around the long term line of action. It looks like it has completed its pullback in time and retracement, and volatility, like sentiment, is ready for a trend change

The Long Count – The Big Picture
I want to talk about the big picture in Elliott Wave Terms for a few minutes.
First I am not going to comment on the Supercycle Wave, Grand Supercyle or Millennium Wave, that is will beyond the scope of this post and well beyond my investing horizon. I am trying to look out between the next week and few months for my trades and the next 15 years for my investments. Beyond that, there are way too many unknowns. So in order to understand the wavecount for a normal traders or investors time horizon, we need about 50-100 years of data to establish trend / countertrend moves. The logical start point (at least for my purposes) is the 1929 crash and the Great Depression.
The roaring 20s was the culmination of a long rally from the late 1800s (there was a panic around 1900 and again around 1910). Previous to that (within modern history, say the last 150 years) there were a number of rallies and corrections, but nothing like the run up and crash of 1920-1935. So the Great Depression was a very strong down move that corrected much of the huge run up previous to the 1929 crash. And what have we had since 1929? A very huge run up. Here the term run-un is NOT used pejoratively. Much of the was an actual true bull run with positive and increasing fundamentals..
Now I will show a chart in a second and I want to make a few things clear. IMPORTANT: read these next several paragraphs before looking at the next chart. The move from 1929 to 2000 was an enormously long bull run. There was nothing “fake” about this move. America was a hugely productive society and economy. This represented real growth and real value being built, and productive enterprises being formed. It was a “true” bull run. Notice that I say to 2000, not 2007. I do not believe that 2007 was the top, even though it was higher (at least on the Dow). There are many reasons, but here are the two big ones:
1) When adjusted for inflation, the “true value” of the market in 2000 is higher than it was in 2007, and
2) The Wave personality fits. 2000 was a peak in euphoria and proclamations of “market invincibility”. This was as America got rid of much of its productive enterprises that we built up over the last 60 years and put its faith in financial instruments and outsourcing as the way to maintain the “healthy economy”. The market begins its correction after the unsustainable parabolic runup in the 1990s (as this transition from healthy to unhealthy economic activity takes place). However the euphoria would not diminish and the market tried another stab at the top. This is the textbook definition of a Wave B. “B Waves are phonies, they are sucker plays, bull traps, speculator’s paradise, or expressions of dumb institutional complacency. They are rarely technically strong, unconfirmed by other averages, and doomed to retracement by Wave C”
Here is the biggest tell for 2007 being a Wave B peak. 2007 is a new high on the Dow Industrials, it is a double top on the S&P 500, and it is almost 50% lower than the 2000 peak on the NASDAQ composite. It is so highly unconfirmed that it is utterly unbelievable.

Comments on this chart and the market: I do see a 67 year long bull move (1933-2000) that results in a clear 5 wave impulse. I am calling this wave a large “[11]” (in quotation marks). Then the next move needs to be a 3-wave corrective impulse {A} {B} and {C} to make a “[22]” (again in quotation marks) . If {A} lasted 3 years and {B} lasted 4 years, I would expect {C} to last between 4 and 7 years. This will be necessary to make a proper correction in terms of time (e.g., It is unlikely to have a bull run for 67 years and a correction for only 9 years – i.e. ending now).
This of course is my opinion. But if you look at the market in terms of scale and proportionality in both price and time, this seems to make sense. So while inflation will help to prevent a crash down to say the price level of the 1960s, I don’t think it will diminish the time aspect. The market needs to correct, and there is no amount of government bailout money that can undo that process. With copious amounts of new money, the Treasury and Fed can soften the blow for a stock crash and they can (attempt to) bailout financials, but the ramification is a huge increase in the price of real goods (namely commodities). But a correction needs time to unfold. Because new money doesn’t fix the problem, it just moves the problem around. From my point of view, this correction is going to play itself out, and need the time to do so, whether we like it or not.
So, how will it unfold?
I have a guess, of course. I talked about this in my last post and I will recap it right now. The {C} wave needs time to unwind. And the {C} wave correction (which will be an impulse – C waves are ALWAYS 5’s) has only been going on since mid 2007, only about 2 years. This has not been enough time and price correction to adequately correct the bull run since the Great Depression, IMO. So my opinion is that there is almost zero chance that 666 on the S&P 500 is the bottom. It *could* be the bottom for this year (maybe, maybe not). But I put a very high likelihood that 666 will be broken before we find any kind of true bottom.
So when I look at the body of evidence: The long EW count since the Great Depression, the failed move of 2007 on most indices to make new highs, the fact that most of the worlds stock indices moved down as the result of a global financial meltdown, the US economy still dependent mostly on consumer spending and how consumers are going to be squeezed in the coming months and years from unemployment and lower home prices, and how financials are going to get further hit by the next wave of Option ARM resets and subsequent defaults due to unemployment and lower home prices, the next wave of Credit Card default, etc. .., when I look at all of this I see a large impulsive C wave starting in 2007 and the 5-wave move from mid 2007 to March 2009 makes only the first wave (Wave 1) of that large C Wave.
And I think that projection COULD look something like this:
First, here is the original projection that August 27:

And here’s how it looks today:

Next is an updated version of a chart that I originally showed in this post Projections, In the Corner of My Mind – Nov 12, to discuss how I see the P2/P3 transition and how P3 could play out. Please read the link above to get more thoughts on this chart:

Personally I do not find this to be that unrealistic at all.
This is a BIG DEAL! This is why I don’t mind being called a "P3 cheerleader" !!! Because if this is right – even just a portion of it, maybe the fall isn’t so deep — then you need to be warned so you can TAKE ACTION !!!
This wave will destroy more wealth than you can fathom. And please do not be come the bagholder for P2.
Here is my little speil on why I think US equity prices will still drop despite the inflationary environment
— If I thought the outcome was truly deflationary, I would be making a call for the S&P to drop to 133 (during 1929, after the initial 50% drop, the stock market dropped another 80%! over the next few years). 20% of 666 = 133. And no I do not think that is realistic given government policies. I think something like ~400 on the S&P (~4000 on the Dow) is more realistic
— But what the big drop in the middle of inflation?
— Because earnings still stink!
— Additionally, simply because there is monetary inflation does not mean there will be across the board price inflation (i.e. If TMS is increased by 10%, that does *not* mean that toasters, houses and equities will also increase in price by 10%). Read these articles by Steve Saville to understand why: Steve Saville: The Inflation Process and Steve Saville: Market Value, Money and Credit
— Inflation is not enough to keep prices high (I think all the inflated money will find itself in real assets, most especially gold and also commodities, not the stock market), however, I think inflation will keep prices in the stock market from dropping as low as they otherwise would
— Inflation will also help earnings from dropping in prices terms as low as they would go (in real terms they will be much lower)
— I have said before, that the market needs to make a bottom in terms of valuation before it can go up again, and historically that is when PE is 6-10 (for the SPX and INDU). For an excellent discussion on these very long term valuation cycles, read this article, Zeal: Long Valuation Waves
— Just for kicks, lets use PE = 8 as the bottom.
— Earnings (GAAP) from good analysts (such as Mauldin) are around $40. And for the sake of argument, lets say they stay the same for the next few years (I see a much stronger argument that they will actually shrink, I see no compelling argument that they will grow). But lets say inflation keeps them about $40.
— PE of 8 * $40 earnings = $320 Price of S&P at the bottom
— This is where I get my ~400 estimate for the S&P.
— I think we will have inflation big time, but I think the market fundamentals are so bad that they will fall regardless of inflation
— Incidentally, my gold argument still stands. Dow at the bottom of ~$4000 / SPX at the bottom of ~$400 (not as bad as an equivalent Great Depression move) still puts Gold at $4000 eventually if you believe like I do that the Dow-Gold ratio will bottom at 1 (or even less).
— Gold is not only an inflation hedge (true inflation = monetary inflation, which eventually finds its way *non-uniformly* into prices) but is insurance against bad economic policies and financial shenanigans.
…. Those are all of my large count assumptions and why I have come to those conclusions.
I invite you to read my points and think about them. Don’t take my word / thinking / research / analysis for it. Research these topics yourself. Think about these things, come to your own conclusions. Maybe you reach the same conclusions as me, maybe you don’t. But this is important enough to discuss and to discuss fully. Not just some aspect. Not simply taking economic data out of context and twisting it into a bullish or bearish stance. But a real honest discussion of the full scope of technicals and fundamentals. That is ultimately why I write and post this. To share my thoughts and ideas and to have a discussion about them.
Assuming You Believe Any of My Analysis Above, What Makes Sense as a Long Term Investment?
Note my specific terminology "long term investment". Not trades, not something to be held for 3 months or 6 months, but what makes sense for the long term (5-15 years). For myself (I am not recommending anything to anyone else, just sharing my own thoughts on how I see the situation), the answer is primarily gold with commodities as a close second. Real Assets makes the most sense. Given the economics weakness, and the inflationary Quantitative Easing / debt monetization policies designed to combat and offset the weakness (and if you noticed during the last FOMC meeting, plans were unveiled to buy even more Mortgage Backed Securities (MBS’s)), real assets make the best protection. Not cash, and absolutely not Treasuries.
But gold is much more than an inflation hedge. In fact to call gold only an inflation hedge is incorrect. Gold is not only a hedge against inflation, but is a hedge against financial shenanigans and economic instability (loss of confidence). Saville puts it as "gold is a hedge against specific economic conditions". And for those of us who are bullish on gold, we think it is exactly the set of conditions we are currently in, and will be in in the future.
Will gold or oil go down in the short term? Maybe, perhaps even likely. How much? Don’t know. How long might they correct? Don’t know. And moreover, I do not care.
I have no interest in holding large amounts of "fake money" (US Dollars) to try to time the best purchase of "real money" (Gold). Others may play that game or even advocate it. I will not. I believe a currency crisis in the US Dollar is highly probable, if not inevitable. And maybe there will be warning signs, or maybe there won’t be. This is a Black Swan event in the making, which makes the timing by definition unpredictable.
So in my investment account: I am in gold now, and I add on pullbacks.
Instead of me talking about gold here, I have a whole set of posts very specifically focused on Gold and the US Dollar, and I would highly suggest that you read them:
– The Gold Blog. Gold/Silver/GSMs (and a little Oil for good measure) Sept 11, 09
– Thoughts on the US Dollar, Analysis of the USDX Long Term, Follow up on the Gold Blog – Sep 17, 09
– Thoughts on the Dow/Gold Ratio – Oct 19, 09


