
1929-32 Market Decline Has Almost Been Repeated
Courtesy of John Lounsbury
The 10-year bear market in stocks has accelerated in the past two years. What about the bull market from 2003-07, you ask? It didn’t exist if you use gold (GLD) as your medium of exchange. This can be seen in the following graph from ChartOfTheDay.com:
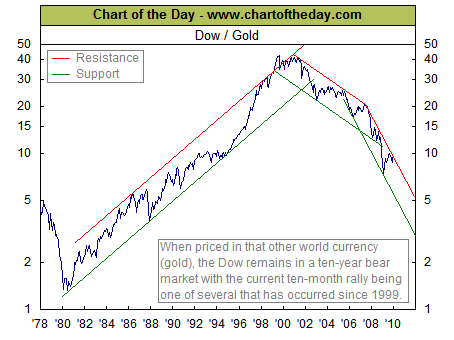
We are currently about 79% below the market top of late 1999 to early 2000. At the market low in March, we were down about 82%. At that point, we were close to the 89% decline of 1929-32, when the market was actually traded in gold due to the gold standard for the U.S. dollar.
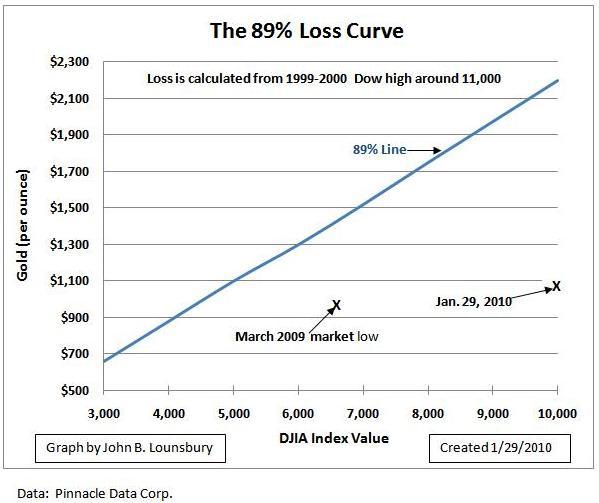
The following graph shows the relationships between the Dow-listed value and gold for an 89% decline from the market top – the Dow as of Jan. 29, 2010 and as of the recent market low in March 2009.
In an Instablog today, I suggested that making comparisons of today to the start of the Great Depression had more curiosity value than utility. I received some criticism for that remark.
In this analysis, the curiosity value has more utility than most comparisons (at least for me) because it shows how close we have already come to repeating the market decline of 1929-32. The parameters can be read from the chart for an exact reproduction. For example, Dow at 10,000 and gold at $2,200 or Dow at 7,000 and gold at $1,500 produce a loss of 89%.
Disclosure: Currently own GLL (short gold).