Courtesy of Market Tamer
Improve Your Timing: The Ascending Triangle Chart Pattern
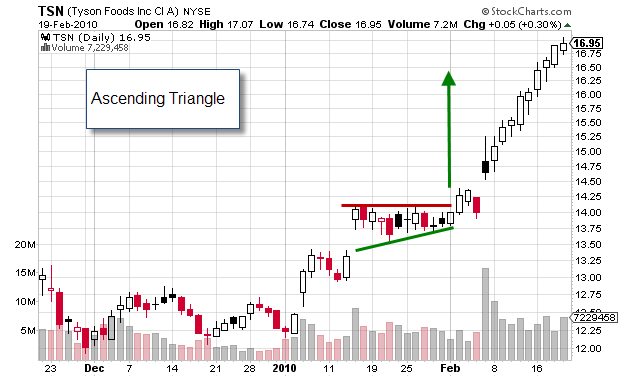
- The Ascending Triangle is a bullish continuation pattern and is comprised of an upper trend line that is horizontal which acts as resistance and a lower trend line connecting higher lows and converging towards the upper trend line.
- The pattern is found in a bullish market and is generally considered a continuation pattern although it can sometimes reverse the market.
- The breakout point is above the horizontal upper trend line and the target move after the breakout is the widest part of the triangle added to the breakout point.
- The stock begins to stagnate to the upside with wider range trading. The upside trend line remains as strong resistance as the stock begins to put in higher lows. The investment community is telling us that there is a diminishing desire to take the stock lower and the presence of a converging lower trend line bodes for an upside breakout above the upper trend line.
- The buying pressure is evident as the stock puts in higher lows while stubbornly holding steady at the high of the range.
- Eventually, the stock will break through and past the resistance to establish new highs on increased volume.