Courtesy of Market Tamer
Improve Your Market Timing: The Descending Triangle Chart Pattern
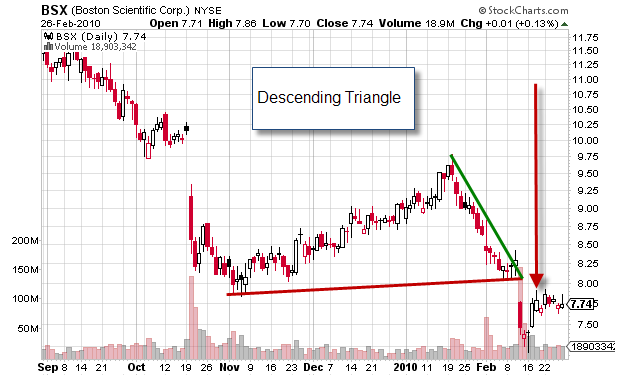
– This Pattern is the inverse of the Ascending Triangle and is a bearish continuation pattern.
– The stock has formed consistent support as evidenced by several touches on the lower and basically horizontal trend line as the upper trend line posts consistently lower highs.
– The selling pressure is evident as the trend lines converge and the breakdown point is the breach of the lower horizontal trend line on increasing volume.
– The stock has repeatedly challenged the lower horizontal trend line which acts as support but has not breached the level.
– Selling pressure is present as evidenced by the lower highs and are depicted by the converging upper trend line.
– Eventually, the stock will usually break through the support n increasing volume and will continue its downside move.