

John Nyaradi is a new contributor to Phil’s Stock World and will be providing weekly market summaries as well as updates during the week. He publishes Wall Street Sector Selector, an online newsletter specializing in sector rotation trading using Exchange Traded Funds. He is also Senior Vice President, Marketing and Private Client Services for ProfitScore Capital Management, Inc.
John is offering readers a 30 Day Free Membership and Free Special Report, "Slay the Dragon Within: How to Make Your Emotions Work for You Instead of Against You." His service provides signals for going long and short using standard and leveraged ETFs and teaches readers how to seek profits in both up and down markets. Free Membership Subscribers also get access to the Wall Street Sector Selector Monthly Webinar and a second Special Report, "How To Avoid the Buy and Hold Trap." – Ilene
A Big, Bad Bear Market Just Ahead?
Courtesy of John Nyaradi, Wall Street Sector Selector
Recent stock market action has brought major indexes around the world into bear market, or at least significant correction territory.
At Wall Street Sector Selector, we remain in the “Red Flag Flying” mode, expecting still lower prices ahead.
We had a good week in our inverse and cash positions and our current portfolios year to date are as follows:
- Sector Selector Standard: +12.6%
- Sector Selector 2x: -10.6%
- Sector Selector Option Master: +60.5%
This week we added two inverse ETF positions in the Standard Portfolio, one to the 2X and maintained our Put Option position in Option Master.
Looking at My Screens
Aside from providing plenty of fireworks this week, global stock market action inflicted significant technical and psychological damage on indexes around the world. Some of the statistics are quite shocking and we’ll take a close look at the current state of the markets and where we might go from here.
One of the main charts I use in my work at Wall Street Sector Selector to determine the overall status of the market is the NYSE Bullish Percent Indicator (click to enlarge).
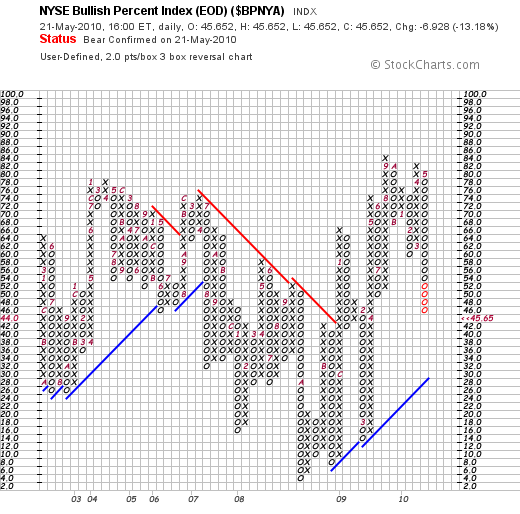
Chart courtesy of www.stockcharts.com
In the above chart, you can see that the BPNYA went to “Bear Confirmed” status on May 21, 2010. This indicator measures the percentage of stocks on the New York Stock Exchange that are on Point and Figure Buy Signals and whether or not the entire universe of NYSE stocks is in an uptrend or downtrend.
Above we can see that approximately 50% of NYSE stocks are on buy signals and that the last column of “Os” broke a double bottom to generate the “bear confirmed” signal.
You’ll also notice that the last column of Os made a lower bottom than the previous column of Os which tells us that this current decline is more broad based than the one in January and we see a pattern of lower highs and lower lows which indicates an overall weakening market environment.
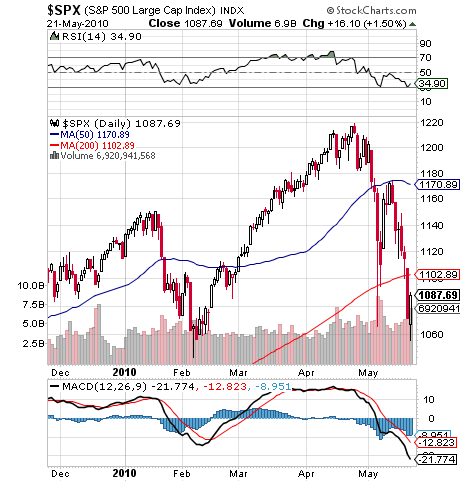
Chart courtesy of www.stockcharts.com
In the chart above (click to enlarge) of the S&P 500, we see that the index has broken decisively below its 200 Day Moving Average which is commonly thought of as the demarcation between a bull and bear market. So far, just two days have closed below this average and it usually takes several days below the 200 Day Moving Average to confirm a new bear market, so clearly this chart offers a second early warning indicator that a new bear market might be upon us.

Chart courtesy of www.stockcharts.com
In the chart above (click to enlarge), we see that the S&P broke a double bottom on May 21, 2010, and so generated a “sell” signal with an initial price target of 940. The S&P is still above the blue Bullish Support Line so according to point and figure charting methodology, the primary trend is still up. However, a break below approximately 920 would indicate a new negative long term trend in the index.
From the above discussion we can see that current indications would support the thesis that we’re in at least a short term correction or that a bear market has or is about to start.
Other startling facts abound:
- On the New York Stock Exchange, just 51% of stocks still remain above their 200 Day Moving Average, down from approximately 85% at the beginning of May, just three short weeks ago.
- 12% of stocks are above their 50 Day Moving Average, down from almost 90% at the beginning of the month.
- The Shanghai Stock Exchange, often thought of as a bellwether index, is in solid bear market territory, down -20% from its recent highs, while U.S. indexes flirt with traditional definitions of “correction,” declines of -10% or greater.
The View from 35,000 Feet
Most of the recent carnage has been attributed to the problems in Europe with sovereign debt and the collapse of the euro but there is more to the story as this stock market shakeout rattled countries around the world.
The problems begin in Europe where the survival of the euro and the European Union is at stake and their leaders and populace seem unable to get in front of this issue. While the bureaucrats dither, the people strike and march in the streets and it increasingly appears that the entire zone could descend into financial if not political anarchy.
Moving around the world to China we see the new economic engine of the world sputtering as it deals with a real estate bubble and the threat of inflation and so is tightening credit and raising interest rates while the rest of the world battles with what could be impending deflation and depression.
At home, investors experienced yet another trying week as volatility spiked to new highs and people watched the markets shave billions off their retirement savings.
Fortunately, we were immune from the carnage as we watched the drama unfold.
Yellow lights flashed everywhere as economic reports came in through the week:
- May Empire State manufacturing report sports steep decline
- April Building Permits unexpectedly fall
- Initial jobless claims rise unexpectedly
- Consumer Confidence falls unexpectedly.
- April Producer Price declined -0.1%, unexpectedly
- April Leading Economic Indicators declined, unexpectedly
- LIBOR continued to rise to highest levels in nearly a year.
- Oil declined nine days straight on doubts regarding the strength of the recovery.
- Another bank failed, bringing year’s total to 73.
- Reuter’s reports that the Economic Cycle Research Institute Weekly Leading Index hit a 35 week low and its annualized index dropped to a 43 week low, prompting Lakshman Acuthan, director of ECRI, to say, “With WLI growth sinking further to a 43 week low, U.S. economic growth is set to start easing in fairly short order.
What It All Means
Adding it all up, it’s difficult to make an argument for a robust stock market going forward on either a technical or fundamental basis while it’s quite easy to forecast a new bear rumbling down the path towards us.
As investors and traders, we have two choices if we believe a new bear market is upon us; actually three.
The first choice is to “buy and hold” which is the conventional wisdom and which I believe is quite ineffective in today’s volatile markets since the Dow is still far below where it was in 2000 at the beginning of the “tech wreck” more than 11 years ago.
The second choice is to head for the safety of cash which many investors have done or to head for the safety of Treasury bonds and bills which have also seen a huge influx of funds in recent months and days. This strategy gets you out of harm’s way if the market indeed does continue its downward trajectory.
The third choice is to actually attempt to profit from declining markets and to do that, investors/traders today can use inverse exchange traded funds that move opposite to the action of the underlying index.
That, of course, is our goal at Wall Street Sector Selector and all of our strategies and tactics are designed to seek out opportunity and profits regardless of whether the markets are going down or up.
In the short term, I believe we will see an attempt to retest and close above the 200 Day Moving Average on the major indexes which may or may not fail. Recent down days have been on huge volume while up days have been on low volume, and so overall, the path of least resistance is most likely down in the medium to long term.
The Week Ahead
Economic Reports:
Monday: April Existing Home Sales
Tuesday: March Case/Shiller Home Price Index, May Consumer Confidence
Wednesday: April Durable Goods, April New Home Sales
Thursday: Quarter 1 GDP second estimate, Initial Unemployment Claims, Continuing Unemployment Claims
Friday: April Personal Income, April Personal Spending, May Chicago PMI, May University of Michigan Consumer Sentiment
Earnings Reports:
Wednesday: Toll Brothers (TLGD)
Thursday: Costco (COST), Novell (NOVL)
Sector Spotlight:
Leaders: Short everything
Laggards: Coal, Australia, emerging markets.
Disclosure: VXX, EEV, YXI, PSQ, EFZ, SKF, S&P 500 Put Options.


