Great collection of charts on everything, courtesy of Michael Clark, CLARK’S GATE TIMING SYSTEM
CGTS: END OF THE RAINBOW FOR THE BEAR TRAP RALLY?
INDEX VIEW
In our last instablog we tried to figure out from inspecting charts if this correction was going to be a normal correction (another "buy the dips" opportunity in the Bernanke-funded rally) or a "falling out of bed nightmare" for investors, perhaps testing the lows of March 2009.
Looking at a close-up of the NDX (below) we see an index that is making lower lows and lower highs in terms of the short-term trend. This is bearish, but not damning. The short-trend can go bearish and the longer-term trends remain bullish. However, in a bear market, after a rally, the short-term trend always goes bearish first — so this is something to keep an eye on.

Technical analysts have always used moving averages to try to get a long-term picture of the markets. So Let’s look at the 200-day moving average and see what it is telling us. First, let’s look at the same NDX (Nasdaq Index) through this different lens.

The 200-day moving average crossed over the price bars in March 2009 on the bottom side and is crossing over the top side now, indicating trouble for another NDX advance. Let’s look at some other charts to get a sense of what theme is beginning to play out in the global markets:

Australia looks tired as well. The markets are short-term oversold — but this does not mean that an ensuing rally will be sustainable.

Brazil is rolling over.

Indian ETF looks to be ending its run up.

France is breaking down.

Germany is also topping, in terms of the 200-day moving average.

The British market has rolled over.

Hang Seng has turned negative.

The Korean Market seems to be turning.

Russia seems to be reaching a price-limit.

The Spain market finally seems to be acting rationally.

Shanghai seems to be heading back to March 09 support.

Turkey’s markets had a good run up; but they might be coming back down.

Taiwan seems to be breaking back down.
So much for the global stock markets. How about American markets — how do they look through this 200-day moving average lens?

The Pharmaceutical Company Index does not look promising.

The S&P 500 has ‘crossed the line’.

Computer Stocks are not promising.

Oil and Gas Stocks are breaking down — one wonders how much of this is led by our (former-) friends laboring down in the Gulf.
If the economic recovery is real and sustainable, copper prices, oil prices, basic materials prices should be showing it — right?

Timber is going negative: what housing recovery?

Oil, anyone? Is this the picture of deflationary momentum?

Copper is perhaps the most negative of all the charts today.

Wait — the chart of Industrial Metals is even more negative.

What about steel prices? If this is a real recovery, steel prices must be inflating? They have inflated — but seem at the end of the rally.

US Gasoline? Looks to be topping also.

Heating oil? Not much of a rally — but it looks to be heading down again.

How are Retailers doing? Pretty damn good…but…what’s going on now?
Ok, so the recovery looks dicey using the 200-day moving average lens. How about the VIX, is it really signaling a major turn in stocks?

VIX has turned up through its 200-day moving average for the first time since the market crash in 2009.
Ok, but the rally in the US Dollar is about over — right? Well, not really. In fact, it just started.

How close is the Euro to its bottom?

Umm, not so close. The Euro looks to be headed lower.
What about reverse ETFs, short positions that rise when the stock markets fall? Well, they all seem to be correcting upward.


We have a couple of interesting trading signals today: shortsell signals on both Warren Buffet and Lloyd Blankfein. (Perhaps there is a God afterall!) Both are short-term oversold; but the signals are saying that their decline is not over.


The same trading system is giving a buy signal today also: BMI. Do we like this signal, in a declining market? Well, the market will try to rally here. We’re not sure stocks will be able to muster much upside. Also the trendline in the lower pane is a bit flat in its trajectory. This could mean the rally will be flat. We generally don’t buy stocks with a flat trajectory. However, a strong move up would change the trajectory. So we’ll watch this one closely to see where it goes.

More information on this system can be found at home.mindspring.com/~mclark7/CGTS09.htm
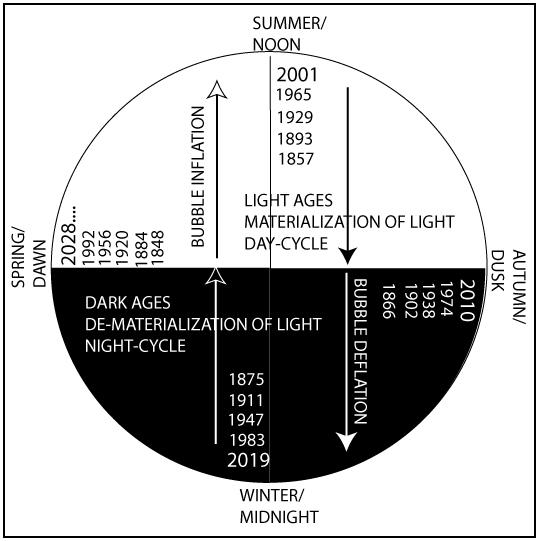
A draft of the book Turn Out the Lights can be found at the website below. This book is a description of the metaphysical causes of the economic cycles of expansion (Day) and contraction (Night).
www.hoalantrangallery.com/Turnoutlights.htm
Michael J. Clark’s Gate Timing System
Hanoi, Vietnam