BCG’s study confirming observations and charts (below), the rich are getting richer and the poor are getting poorer. In the US, the recovery in wealth in 2009 was driven by resurgent financial markets (90 percent of the measured growth). – Ilene
Global Wealth Stages a Strong Comeback, but Wealth Managers Still See Performance Declines and Challenges Ahead, Says Study by The Boston Consulting Group
NEW YORK, June 10, 2010—Global wealth staged a remarkable comeback in 2009, increasing by 11.5 percent to $111.5 trillion, just short of the year-end peak set in 2007. But the rebound in wealth should not be seen as a return to business as usual—client trust and wealth manager performance are still lower than they were before the global economic crisis, according to a new study by The Boston Consulting Group (BCG).
Findings from the study appear in BCG’s tenth annual Global Wealth report, titled Regaining Lost Ground: Resurgent Markets and New Opportunities, which was released today at a press briefing in New York. Among the other key findings:
- North America posted the largest absolute gain in wealth at $4.6 trillion (15 percent), but the largest percentage gain—and the second largest in absolute terms—occurred in Asia-Pacific (excluding Japan), where wealth increased by 22 percent, or $3.1 trillion. That was nearly double the global rate.
- Latin America had the second-highest growth rate at 16 percent.
- Europe remained the wealthiest region. Its $37.1 trillion in AuM represented one-third of the world’s wealth. It was one of several regions where wealth surpassed its precrisis year-end peak.
- North America and Japan were the only regions where wealth remained below the year-end 2007 levels.
- North America accounted for about 40 percent of the $11.5 trillion increase in global wealth in 2009. Its wealth increased to $35.1 trillion.
BCG projects global wealth to grow at an average annual rate of nearly 6 percent from year-end 2009 through 2014—much slower than the sharp recovery in 2009 but still higher than the 4.8 percent annual growth rate from year-end 2004 through 2009.
“There’s no doubt that wealth will continue to grow faster in emerging markets, fueled by strong economic growth,” said Tjun Tang, a BCG partner and a coauthor of the report. “We expect Asia-Pacific, excluding Japan, to grow at nearly twice the global rate, raising its share of global wealth from 15 percent in 2009 to almost 20 percent in 2014.”
The recovery in wealth—which virtually offset the 10 percent plunge in global AuM in 2008—was driven by resurgent financial markets and increased savings. In North America, higher market values accounted for 90 percent of the growth. By contrast, market values and savings made nearly equal contributions to AuM growth in Europe and Asia-Pacific (ex Japan).
The Ranks of Millionaire Households Swell
Wealth became slightly more concentrated as it grew. Less than 1 percent of all households were millionaires, but they owned about 38 percent of the world’s wealth, up from about 36 percent in 2008. Households with more than $5 million in wealth represented 0.1 percent of households but owned about 21 percent, or $23 trillion, of the world’s wealth, up from 19 percent in 2008.
- The number of millionaire households rose by about 14 percent in 2009, to 11.2 million—about where it stood at the end of 2007.
- The United States had by far the most millionaire households (4.7 million) followed by Japan, China, the United Kingdom, and Germany.
- Singapore saw the highest growth in millionaire households, up 35 percent, followed by 33 percent for Malaysia, 32 percent for Slovakia, and 31 percent for China.
- Smaller markets had the highest concentrations of millionaire households. In Singapore and Hong Kong, millionaire households accounted for 11.4 percent and 8.8 percent, respectively, of all households.
- Switzerland had the highest concentration of millionaire households in Europe and the third-highest overall at 8.4 percent.
- Three of the six densest millionaire populations were in the Middle East—in Kuwait, Qatar, and the United Arab Emirates.
- Despite its large population, the United States had the seventh-highest density of millionaire households at 4.1 percent.
Regulatory Pressure Weighs on Offshore Wealth
Offshore wealth (defined as assets booked in a country where the investor has no legal residence or tax domicile) grew to $7.4 trillion in 2009, up from $6.8 trillion in 2008, largely driven by the market recovery. Not surprisingly, Switzerland remained the largest offshore center, with about 27 percent ($2.0 trillion) of global offshore wealth, according to the study.
But despite the recovery, banks in traditional offshore centers face considerable regulatory and competitive pressures. BCG projects the share of global wealth held offshore to fall from close to 7 percent in 2009 to just over 6 percent in 2014.
“Although undeclared assets account for a small and declining share of offshore wealth,” said Peter Damisch, a BCG partner and a coauthor of the report, “the push for transparency will compel some clients—particularly those in North America and Europe—to move their assets. More important, it will force private banks to adjust their strategies and operating models, and perhaps even to abandon certain markets.”
Benchmarking Reveals a Slide in Performance
To gauge the performance of wealth managers, BCG gathered data from 114 wealth-management institutions worldwide. The survey found that the industry slipped in 2009.
- Although participants’ AuM (Assets under Management) increased by an average of 14.3 percent in 2009, their revenues declined by an average of 7.3 percent, while their average revenue margin—measured by the return on assets (ROA)—fell by 12 basis points to 83 basis points.
- The average costs of participants declined by 3.2 percent in 2009, but it was not enough to offset the fall in revenues. As a result, the average cost-to-income ratio increased to 74.4 percent, up from 72.3 percent in 2008.
- As revenues fell and cost-to-income ratios rose, the average profitability of participants slid to 22 basis points in 2009 from 27 basis points in 2008.
A host of factors contributed the decline in performance, including a drop in transactions, tougher price negotiations, and a migration of assets to lower-margin products.
Anna Zakrzewski, a BCG principal and a coauthor of the report, noted that performance was driven less by the overall level of assets and more by what people are—and are not—doing with their wealth. “Investors have started moving assets out of safe havens, but they still have a lot of wealth parked in basic, low-margin products,” she explained. “Their asset allocations tend to be more conservative than their actual risk profiles. In addition, the use of discretionary mandates is down, as investors remain wary of signing over control of their wealth.”… more here.
About The Boston Consulting Group
The Boston Consulting Group (BCG) is a global management consulting firm and the world’s leading advisor on business strategy. We partner with clients in all sectors and regions to identify their highest-value opportunities, address their most critical challenges, and transform their businesses. Our customized approach combines deep insight into the dynamics of companies and markets with close collaboration at all levels of the client organization. This ensures that our clients achieve sustainable competitive advantage, build more capable organizations, and secure lasting results. Founded in 1963, BCG is a private company with 69 offices in 40 countries.
Click on charts for larger images.
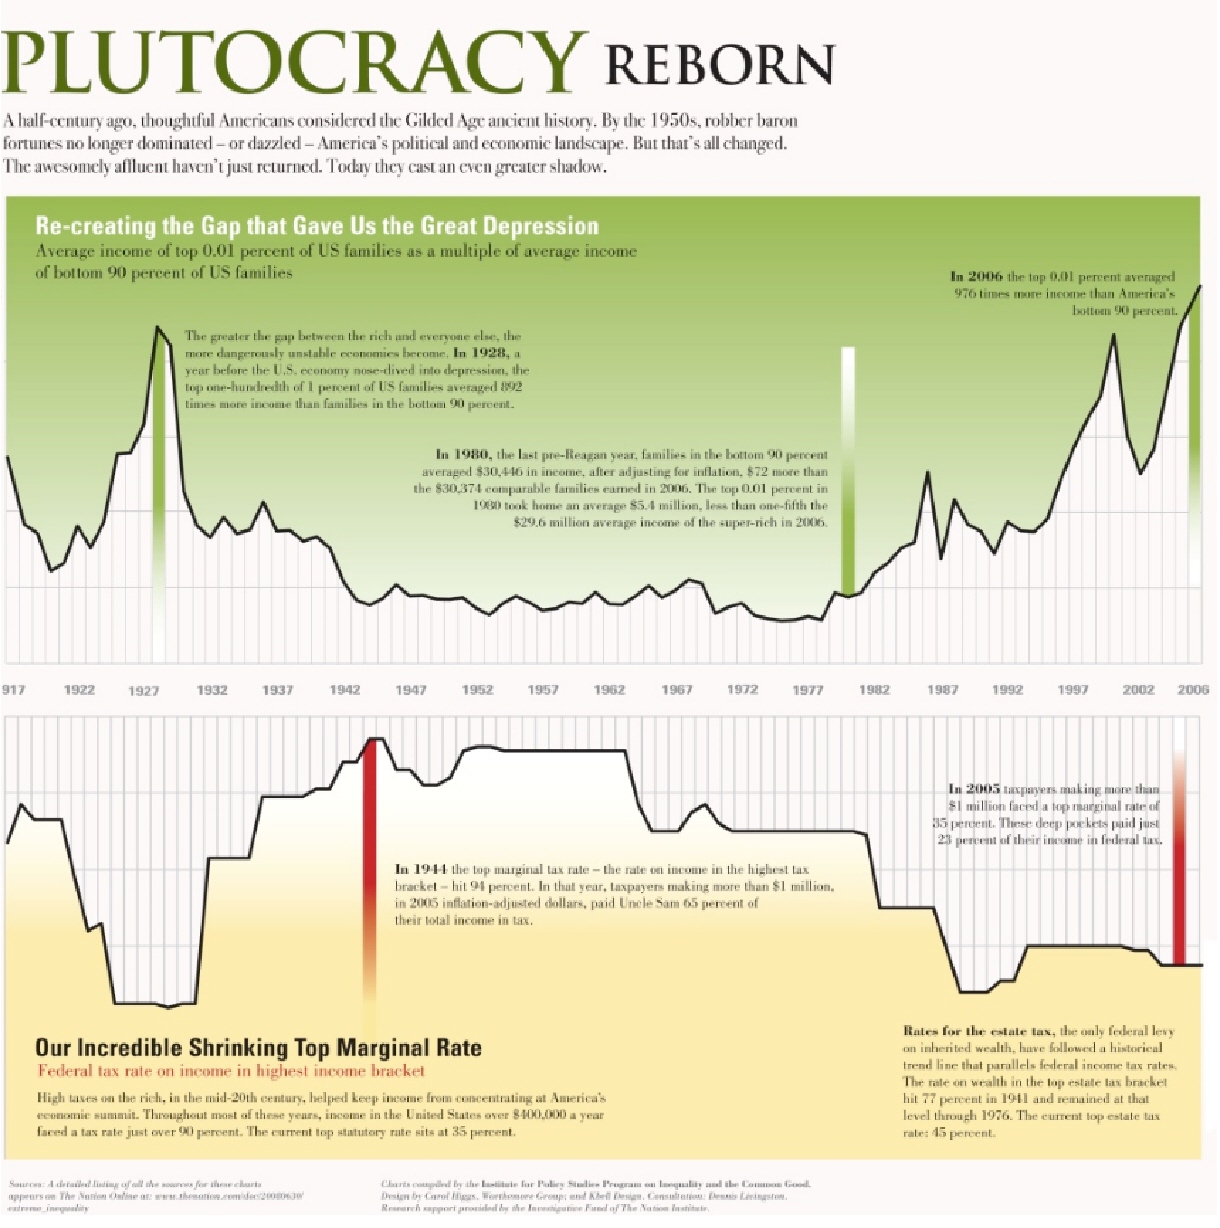
Via The Nation
Via Afferent Input
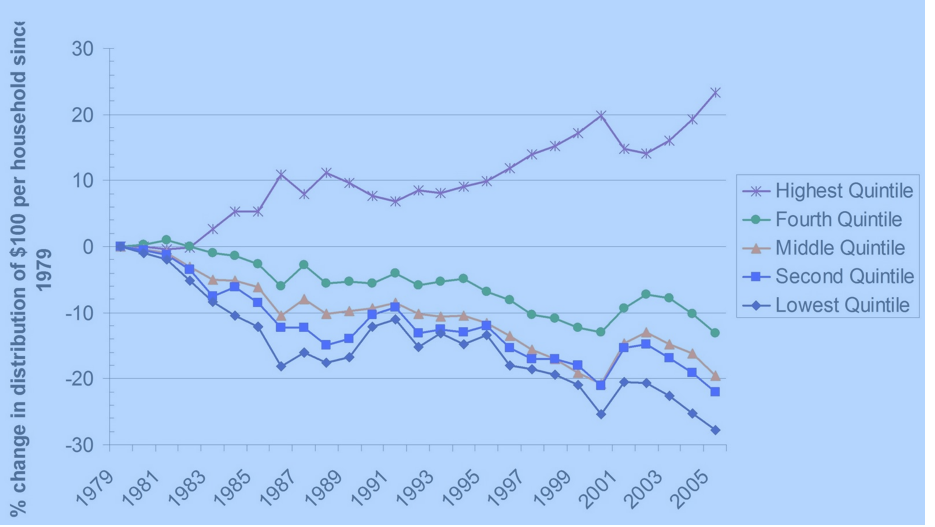
(% split of $100 dollar pie as it changed with time)