
C&I Lending Remains Distressed
Courtesy of John Lounsbury wrting at Seeking Alpha
A graph from David Rosenberg, Chief Economist for Gluskin Sheff (Toronto), shows one of the severe headwinds the recovery is battling. C&I (commercial and industrial) lending remains at historically depressed levels. May of 2010 is at levels 16% below May, 2009, which, in turn, was about 10% below May, 2008.
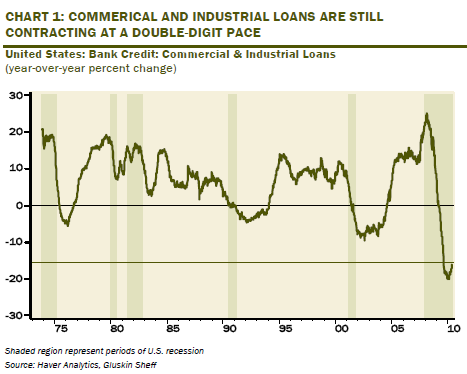
Rosenberg points out the following:
One-quarter of bank credit available for businesses has totally vanished during this intense debt deleveraging cycle (and nobody, including the Fed, knows why this credit contraction is ongoing — see Small-Business Lending is Down, But Reasons Still Elude the Experts on page B3 of the NYT; although in the article, Mr. Dunkelberg is quoted as saying:
“Credit’s not the issue, customers are the issue” in reference to the view that with capex plans near a 35-year low, the demand for loans is unusually low.
The New York Times article referred to is by Sewell Chan and is available here.
The comparison of the current situation to the two immediately preceding recessions is seen with a different perspective in the following graph from the St. Louis Fed:
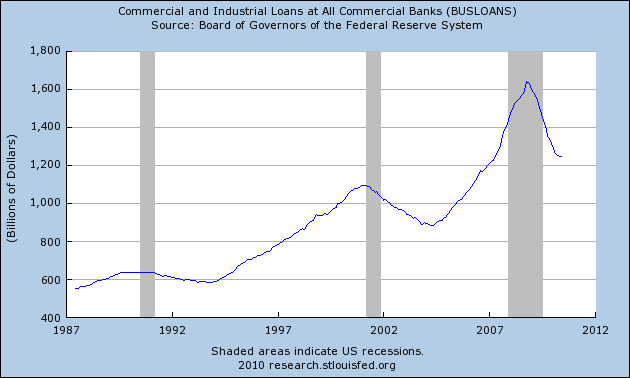
It is noteworthy that C&I loan activity grew more rapidly going in to the current recession and also fell more rapidly as the recession ended. There is also a hint that the C&I loan activity may be bottoming. If this is the case, this recession would also see an upturn in C&I loan activity sooner this time than for the last two prior downturns, which saw loan activity bottoming after a period of time over three years from the peak.
So where is all the lost C&I loan activity? The following graph tells the story:
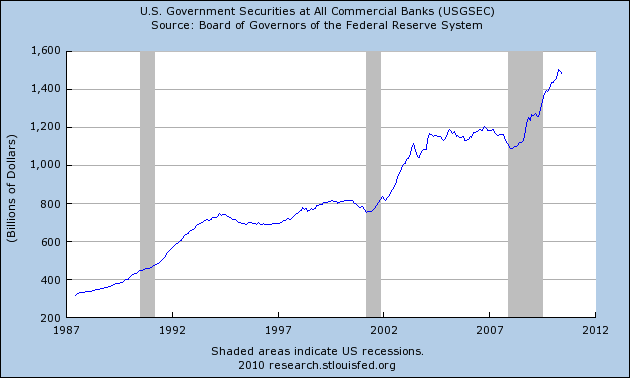
The decline in C&I lending by banks is $400 billion and the increase in government securities held by banks is $400 billion. That match is no coincidence. Bank analyst Chris Whalen has recently argued that the Fed should raise short term interest rates to encourage economic growth. I expect this relationship is exactly what he was looking at.
The effect that Whalen is looking for is a flattening of the treasury yield curve to diminish the profitability of banks borrowing at near zero rates and buying treasuries with interest rate spreads of 2% to 3%+. If the carry trade within the treasury yield curve becomes less attractive, banks could start looking for opportunities in C&I. See article and video clip here.
What is most curious about the Whalen proposal is that steep yield curves are usually predecessors to periods of economic growth and flat yield curves precede recessions. He is apparently seeing a different dynamic now.
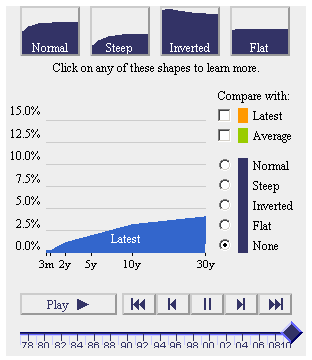
The following graph from Smart Money shows the yield curve as of July 13:
For interactive graphic, click here.
Of course, the entire argument will fail if there is no demand and that is the point raised in the Chan article in the NYT. Loan demand is weak, according to that article.
In the Rosenberg graph it is seen that the recovery of C&I loan activity after recessions in the 1970s and 1980s was much more rapid ("V" shaped) than in the 1990s and early 2000s (broad "U" shaped). Is the starting of a "V" shape this time going to see follow through?
The behavior of the C&I loan activity graphs parallels the shape of employment recovery curves. The broad "U" shapes correspond to the "jobless" recoveries after the 1990-91 and 2001 recessions.
The employment and C&I loan activity curves will probably follow the same paths in the coming quarters because both will reflect the path of new business activity.