I See a Pattern Forming in SP500 and So Should You
Courtesy of Corey Rosenbloom at Afraid to Trade
It’s the same price pattern I’ve been highlighting for quite some time now, but perhaps now is a good time to define the pattern, show it, and state what it means for traders.
Reference my prior post:
“Magic Mystery Buyers in the S&P 500 Define Bull/Bear Battle.”
First, the pattern:
A lot of people are picking up on this pattern – or at least they should. What is it?
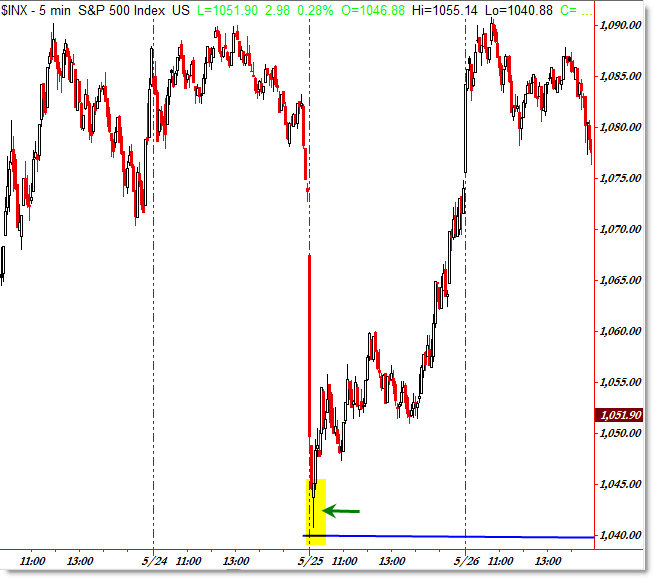
So far, every other day, the S&P 500 has tested the key 1,040 level exactly, and each time – including this morning – buyers have rushed in to support the market, causing a sudden up-burst in price immediately following the test.
The pattern can be described as such:
1. Market falls to test 1,040 (usually on a bad economic morning data-point)
2. Surge of buy-orders flood the market
3. Market bounces very sharply
4. Bears rush to the exits, buying-back shares in a short-squeeze
5. Market rallies to the 1,060 level (or beyond)
That’s the short-term pattern that has been in effect since last week that appears to be repeating into this week.
It’s like a cycle – sort of like Groundhog Day (the movie) – where you wake up and the events of the day repeat themselves exactly.
Traders who have caught on to this pattern early may have made a LOT of money this morning as the pattern repeated.
But this isn’t the only time this has happened – let’s take a look back at the two prior tests of 1,040.
May 25, 2010 (after the “Flash Crash”):

June 6, 2010:

An almost identical pattern of sharp downside move to 1,040 followed by a rush of buy orders that supported and then bounced the market higher occurred just after the Flash Crash and in early June.
To be fair, this pattern failed as the market broke under 1,040 to bottom in early July at 1,010, but one has to admit this pattern is well-entrenched.
By pattern I don’t mean “head and shoulders” or any classical sense of the word, but rather a sequence of events that happen that repeat.
So far, this pattern has successfully repeated 5 of the last 6 instances since May.
While it’s tempting to attribute this to manipulation, it is supply and demand that move market prices.
From where that demand comes -we can debate that all day – if demand/buyers are able to overtake supply/sellers, then the price will rise.
It’s not important to know from where the demand originates – just that it does.
And as price moves – perhaps unexpectedly – off a key support level when traders expected the level to shatter and break, then those traders who bet against support holding -in other words, going short – are then forced to take their stop-losses and cover (buy-back shares). This action helps add demand to the price rise in motion – perversely driving price higher and higher.
So, as long as this pattern is in place – or should I say, these same buyers continue to rush in to buy shares to support the market at 1,040 – we can expect the pattern to repeat.
By the same token, should the market break solidly under 1,040, we can expect these same buyers – assuming they have not been selling shares on the bounces to the 1,060 level (and then re-buying shares at the 1,040 level) – to rush for the exits and take THEIR stop-losses, creating a potentially harsh downside move.


