
Curve Watcher’s Anonymous Investigates the Question "Is the Bond Bull Dead?"
Courtesy of Mish
Curve Watcher’s Anonymous is looking at various long-term and intraday charts of treasuries and the stock market following Tuesday’s FOMC meeting.
$TNX: 10-Year Treasury Yield Intraday Chart

Click on any chart to see a sharper image.
Note the initial spike higher in yields right on the announcement. This headfake is very typical of FOMC announcements.
SPY: S&P 500 Index Shares Intraday Chart

As with treasuries, the S&P 500 had an initial spike that quickly reversed. Both charts show fat tails.
Ultimately the rally failed (which would be typical given the flight to safety trade in treasuries).
Every FOMC meeting it seems we get the same fake reaction: The first move is typically a false move. Sometimes there is a double fake, but only rarely does the initial move keep on going. I would be interested to see comments on this.
Given that I seldom concern myself with intraday or even short-term action however, the more serious question is "Where to from here?"
2-Year Treasuries vs. the S&P 500
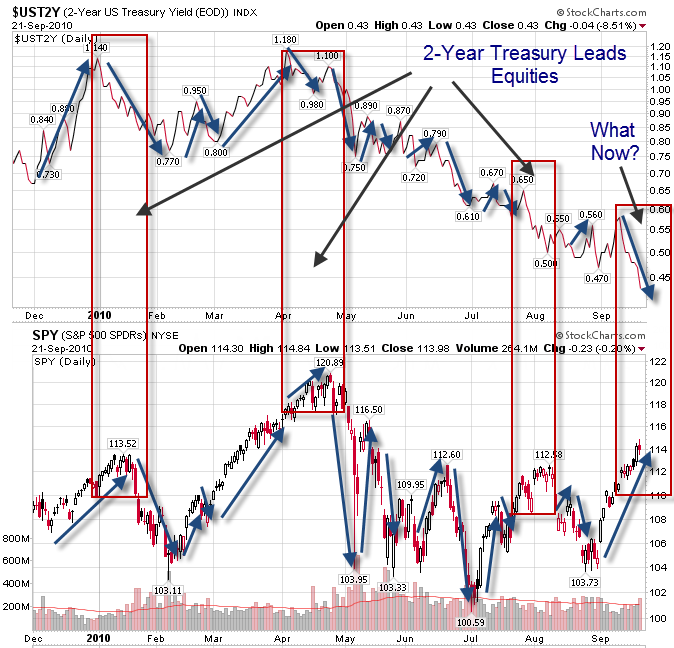
The pattern may not continue, but for quite some time rising treasury yields have generally been directionally aligned with rising equities. In three instances (the first three red boxes), a drop in treasury yields preceded (led) a subsequent drop in equities. The fourth box (where we are now) is unresolved.
2-Year Treasuries – Monthly Chart

Two year treasury yields have fallen to a record low, yet stocks have been rising.
5-Year Treasuries – Monthly Chart

The all time low in 5-year treasury yields is but a stone’s throw away.
10-Year Treasury Yields – Monthly Chart

New lows in 10-year treasury yields are in sight.
To help put things into perspective here is a weekly chart of $TYX 30-year treasuries, $TNX 10-year treasuries, $FVX 5-year treasuries, and $IRX the 3-month treasury discount rate. The other symbols are yields.
$TYX, $TNX, $FVX, $IRX Weekly Chart
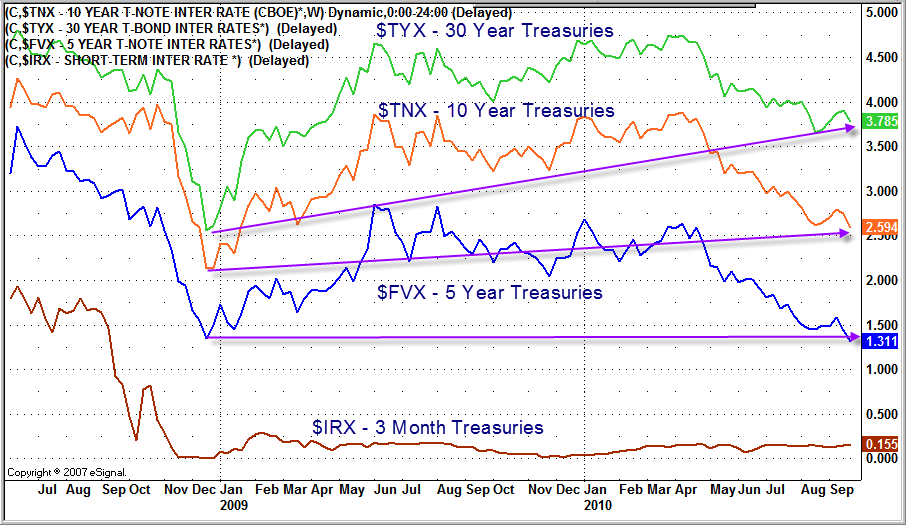
The chart depicts weekly closing values.
Is the Bond Bull Over?
Judging from 2-year treasuries or 5-year treasuries, pronouncements of the "death of the bond bull" were certainly premature. Moreover, given how weak the economy is, I think it is odds-on the 10-year treasury note touches if not breaks the previous yield lows.
Only the 30-year long bond yield seems reluctant to drop. It may not make it.
Regardless, no matter how you look at things, the treasury bull is nearing its end. 30 years is a long run!
However, bull markets tend to end in love affairs. That’s how tops are made. Currently, nearly everyone despises treasuries except the banks and foreign central banks.
As long as sentiment stays negative on treasuries, there is room for long-dated treasuries to rally. There will be a time to short treasuries, but now does not seem like it.