
Jobs Expand by 151,000, Unemployment Steady at 9.6%; Birth-Death Methodology Changes for the Better; Reflections on the Numbers
Courtesy of Mish
Today the BLS reported jobs expanded by 151,000. This should not be totally unexpected as I noted last night in Gaming the Jobs Report that TrimTabs called for +95,000, ADP +43,000, and Gallup showed a surge in October hiring.
Moreover, recent ISM surveys were stronger than expected. The important question this morning is whether or not this surge is sustainable. I do not think it is, nor does TrimTabs.
Here is the Email alert from TrimTabs once again (sorry, no link).
TrimTabs
Sausalito, CA – November 3, 2010 – TrimTabs Investment Research estimates that the U.S. economy added 95,000 jobs in October, the first monthly increase since May.
“The economy clearly improved in October,” said Madeline Schnapp, Director of Macroeconomic Research at TrimTabs. “Unfortunately, the gains probably aren’t sustainable.”
Multiple indicators suggest the labor market perked up last month. Real-time tax data shows wage and salary growth accelerated, TrimTabs’ proprietary measure of online job postings jumped 5.6%, and initial unemployment claims fell to the lowest level since August 2008.
In a research note, TrimTabs argues that the economy will remain stuck in slow-growth mode. October’s employment increase likely owes to temporary factors such as inventory building. Also, a cheaper dollar boosted exports, and record low mortgage rates spurred refinancing activity.
“Economic growth is likely to stay sluggish because the private sector isn’t able to pick up the slack from waning government stimulus,” Schnapp noted. “State and local government budget crises and the weak housing market will be significant drags on growth for a long time.”
I strongly concur with that last paragraph in red above.
I had a typo in the headline number from TrimTabs yesterday (now corrected). The TrimTabs estimate was +95,000 not +75,000 as I had in the title. No changes were made to the body of my post.
Had I read that properly I would have upped last night’s estimates higher by 20,000. I was very aware today’s report might be on the hot side.
This is what I said …
Anything from +40,000 to +110,000 seems like a reasonable guess. I certainly would not be surprised to see a number in the upper end of that range. Stores are hiring, Black Friday sales are starting 3 weeks early, and ISM reports seemed surprisingly strong.
Please see Recap and Reflections at the end of this article to put things into proper perspective as to what today’s numbers mean.
BLS October Report
Please consider the Bureau of Labor Statistics (BLS) October 2010 Employment Report.
Nonfarm payroll employment increased by 151,000 in October, and the unemployment rate was unchanged at 9.6 percent, the U.S. Bureau of Labor Statistics reported today. Since December 2009,nonfarm payroll employment has risen by 874,000.
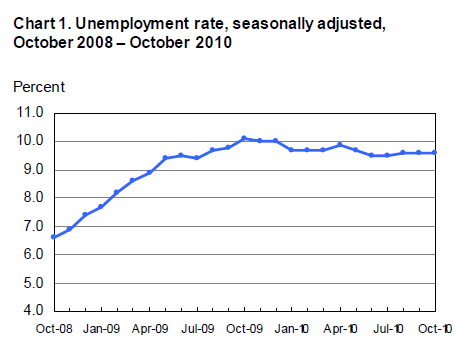
Unemployment Rate – Seasonally Adjusted
Nonfarm Payroll Employment – Seasonally Adjusted

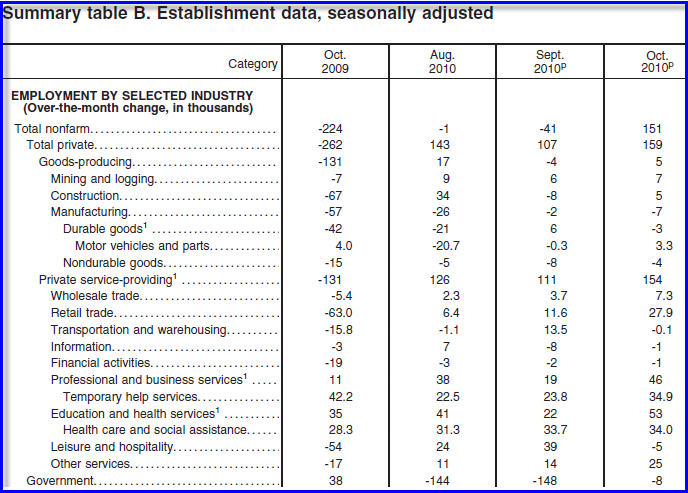
Establishment Data
click on chart for sharper image
Highlights
- 151,000 jobs added
- 5,000 construction jobs added
- 7,000 manufacturing jobs were lost
- 154,000 service providing jobs were added
- 27,900 retail trade jobs were added
- 46,000 professional and business services jobs were added
- 53,000 education and health services jobs were added
- 5,000 leisure and hospitality jobs were lost
- 8,000 government jobs were lost
Note: some of the above categories overlap as shown in the preceding chart, so do not attempt to total them up.
Index of Aggregate Weekly Hours
Production and non-supervisory work hours ticked up by .1 to 33.6 hours. Average hourly earnings rose $.07 at $19.17.
BLS Birth-Death Model Black Box
For those unfamiliar with the birth/death model, monthly jobs adjustments are made by the BLS based on economic assumptions about the birth and death of businesses (not individuals).
Birth Death Model Revisions 2009

click on chart for sharper image
Birth Death Model Revisions 2010

click on chart for sharper image
Birth/Death Model Methodology
The big news in the BLS Birth/Death Model is the BLS is going to move to quarterly rather than annual adjustments.
Effective with the release of January 2011 data on February 4, 2011, the establishment survey will begin estimating net business birth/death adjustment factors on a quarterly basis, replacing the current practice of estimating the factors annually. This will allow the establishment survey to incorporate information from the Quarterly Census of Employment and Wages into the birth/death adjustment factors as soon as it becomes available and thereby improve the factors.
For more details please see Introduction of Quarterly Birth/Death Model Updates in the Establishment Survey
In recent years Birth/Death methodology has been so screwed up and there have been so many revisions that it has been painful to watch.
It is possible that the BLS model is now back in sync with the real world. Moreover, quarterly rather than annual adjustments can only help the process.
Please note that one cannot subtract or add birth death revisions to the reported totals and get a meaningful answer. One set of numbers is seasonally adjusted the other is not. In the black box the BLS combines the two coming out with a total. The Birth Death numbers influence the overall totals but the math is not as simple as it appears and the effect is nowhere near as big as it might logically appear at first glance.
Birth/Death assumptions are supposedly made according to estimates of where the BLS thinks we are in the economic cycle. Theory is one thing. Practice is clearly another as noted by numerous recent revisions.
Household Data
The number of unemployed persons, at 14.8 million, was little changed in October. The unemployment rate remained at 9.6 percent and has been essentially unchanged since May.
The number of long-term unemployed (those jobless for 27 weeks and over) was about unchanged over the month at 6.2 million. In October, 41.8 percent of unemployed persons had been jobless for 27 weeks or more.
Both the civilian labor force participation rate, at 64.5 percent, and the employment-population ratio, at 58.3 percent, edged down over the month.
Involuntary Part-Time Workers
The number of persons employed part time for economic reasons (sometimes referred to as involuntary part-time workers) fell by 318,000 over the month to 9.2 million, partially offsetting large increases in the prior 2 months. These individuals were working part time because their hours had been cut back or because they were unable to find a full-time job.
[Mish Note: In January the number was 8.3 million]
Persons Not in the Labor Force
About 2.6 million persons were marginally attached to the labor force in October, up from 2.4 million a year earlier. (The data are not seasonally adjusted.) These individuals were not in the labor force, wanted and were available for work, and had looked for a job sometime in the prior 12 months. They were not counted as unemployed because they had not searched for work in the 4 weeks preceding the
survey.Among the marginally attached, there were 1.2 million discouraged workers in October, an increase of 411,000 from a year earlier. (The data are not seasonally adjusted.) Discouraged workers are persons not currently looking for work because they believe no jobs are available for them. The remaining 1.4 million persons marginally attached to the labor force had not searched for work in the 4 weeks preceding the survey for reasons such as school attendance or family responsibilities.
Table A-8 Part Time Status

click on chart for sharper image
There are now 9,154,000 workers whose hours may rise before those companies start hiring more workers, about where we were a year ago. The number is down from last month but massively higher than the reported 8,300,000 reported in January.
Table A-15
Table A-15 is where one can find a better approximation of what the unemployment rate really is.

click on chart for sharper image
Grim Statistics
The official unemployment rate is 9.6%. However, if you start counting all the people that want a job but gave up, all the people with part-time jobs that want a full-time job, all the people who dropped off the unemployment rolls because their unemployment benefits ran out, etc., you get a closer picture of what the unemployment rate is. That number is in the last row labeled U-6.
It reflects how unemployment feels to the average Joe on the street. While the "official" unemployment rate has held steady, at an unacceptable 9.6%, U-6 is much higher at 17.0%
Looking ahead, there is no driver for jobs. Moreover, states are in forced cutback mode on account of shrinking revenues and unfunded pension obligations. Shrinking government jobs and benefits at the state and local level is a much needed adjustment. Those cutbacks will weigh on employment and consumer spending for quite some time.
Expect to see structurally high unemployment for years to come.
Keep in mind that huge cuts in public sector jobs and benefits at the city, county, and state level are on the way. These are badly needed adjustments. However, economists will not see it that way, nor will the politicians.
Recap and Reflections
This is the first respectable jobs report in years. The reports earlier this year were padded by part-time census hiring. This report was all private hiring, a very good thing.
However, it is important to put this into perspective. It takes approximately 125,000 jobs a month just to hold the rate steady. Here we have +151,000 and a falling participation rate with the unemployment number flat. This apparent anomaly can be explained by the fact that unemployment numbers are derived from the household survey while the reported jobs number comes from the establishment survey.
The key point to remember is even if we were to see +150,000 jobs a month for the next year, it would not put a dent in the unemployment rate. In fact, if the participation rate rose, it could even go up.
Moreover, it is highly unlikely jobs rise by +150,000 jobs a month, on average, for a whole year.
This month’s rise in jobs was fueled by retail hiring. Retail hiring is not sustainable. Nor is the rise in manufacturing. We might see a few more months of this (or not), but this is highly unlikely to be the start of something big or sustainable.
I still expect to see the unemployment rate back up above 10% in this cycle. While today’s report may not be as good as it gets, it certainly is close to as good as it gets on a sustainable basis.
Expect to see the unemployment rate stubbornly high for a decade.