
Courtesy of David Grandey
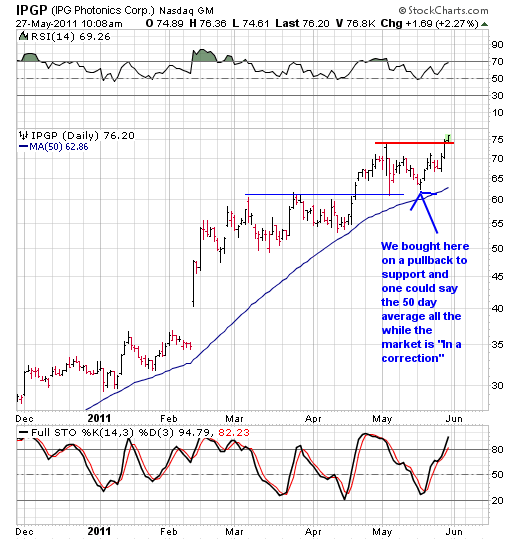
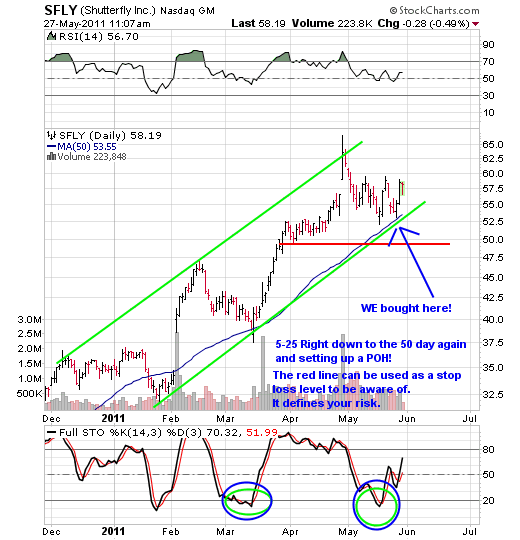
Say it with us! Pullbacks Off Highs and grand slams to the 50-day average are the only two patterns you’ll ever have to know. Be it in uptrending markets or even in markets where some would say “Market In Correction”
Let’s review with some charts of our current holdings
IPGP
INFA

SFLY
ILMN
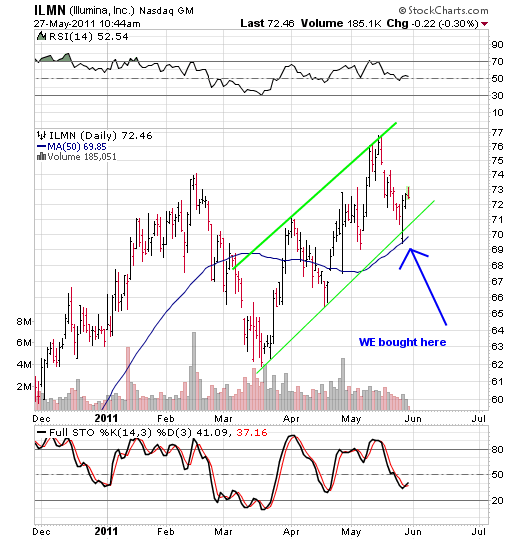
Look at each one. What do you see? For the most part they are all issues in uptrends and above the 50 day average. They either completed a pink line POH or they pulled back to the 50 day or a prior support level. It’s really as simple as that. No need to make life any harder than it is by thinking things through too much.
In addition to the above make sure you check out our current watch list err shall we say the “Featured But Not Trade Triggered By Us List” as the bulk of them all triggered and have moved away from prime entries.
Remember all the while the markets are in a correction this took place. This IS the reason why we eat, sleep and live the statements of:
“Let your stocks tell you what to do by the action they exhibit”
“We trade what we see, not think, hear or fear”
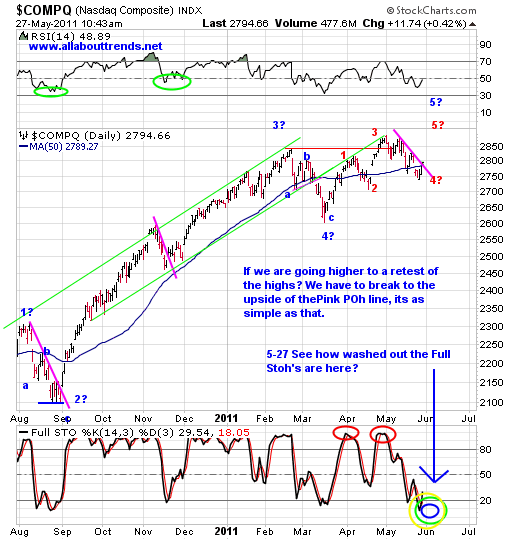
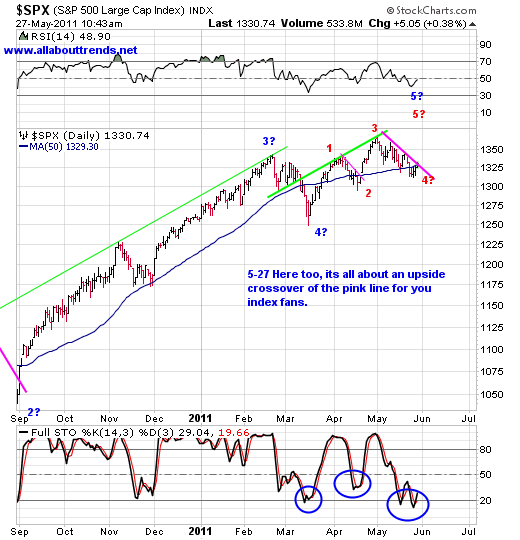
On to the indexes
First off in the daily frequency it’s all about the pink downtrend channel. An upside break is what we need to see.
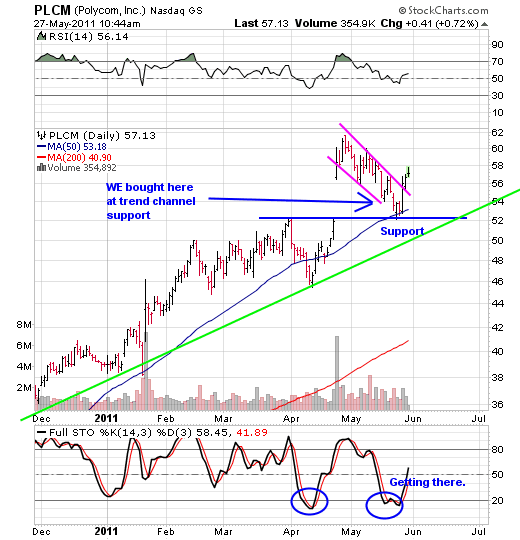
In the 60-minute time frequency take a look at PLCM first. See the downtrend channel? See how it broke above it? That’s exactly what we need to see happen here with regards to the indexes. Of course should we get some rip roaring to the upside from here over the next few days does anyone care to guess what our favorite newspaper is going to say?
Follow Through Day and it’s now ok to consider buying stocks. We say? Really? Most have already moved away from prime low risk POH enty points as shown by the weeks we’ve ALL had here. This is what we mean when we say: ALTERNATIVE ENTRY POINTS
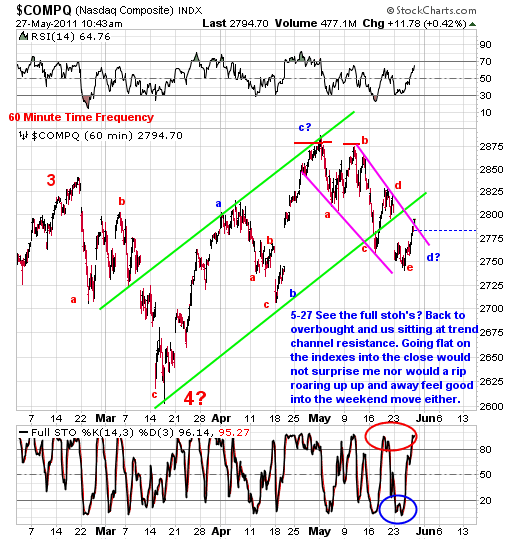
Note: Some of you will observe that the Full Stoh’s on the daily charts are deeply oversold yet on the 60 minute charts are overbought. Why is that? Simple, those are two different time frequencies we are dealing with here.
To learn more, sign up for our free newsletter and receive our free report — “How To Outperform 90% Of Wall Street With Just $500 A Week.”
To learn more, sign up for David’s free newsletter and receive the free report from All About Trends – “How To Outperform 90% Of Wall Street With Just $500 A Week.” Tell David PSW sent you. – Ilene


