
Courtesy of Doug Short.
With all of the Europe news, political noise-making, and the ongoing economic debate, it is easy to lose the focus on what really matters: Corporate earnings.
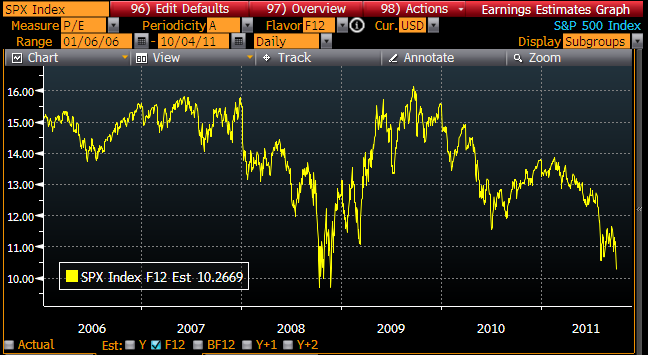
In this earnings season there is a massive discrepancy between analyst forecasts and investor expectations. If the analysts are right, Scott Grannis points out that this is the cheapest market since 2008 when “a multi-year global recession/depression was expected.”
Meanwhile, there has been an absence of earnings warnings.
I will look at the major events of the coming week, but first let us do our review of last week’s data and events.
Background on “Weighing the Week Ahead”
There are many good sources for a comprehensive weekly review. My mission is different. I single out what will be most important in the coming week. My theme for the week is what we will be watching on TV and reading in the mainstream media. It is a focus on what I think is important for my trading and client portfolios.
Unlike my other articles at “A Dash” I am not trying to develop a focused, logical argument with supporting data on a single theme. I am sharing conclusions. Sometimes these are topics that I have already written about, and others are on my agenda. I am trying to put the news in context.
Readers often disagree with my conclusions. (A commenter recently suggested that was proof that I was wrong — an amazing interpretation!) Do not be bashful. Join in and comment about what we should expect. This weekly piece emphasizes my opinions about what is really important and how to put the news in context. I have had great success with my approach, but feel free to disagree. That is what makes a market!
Last Week’s Data
Last week I highlighted some crucial reports. The verdict was pretty positive.
The Good
Good news (which for our purposes means “market-friendly”) came from several sources.
- Progress in Europe. It is there, but most remain skeptical. To the average observer it is confusing since there are many players, many plans, and any solution will be multi-faceted. We are down to two minor participants who have yet to approve the expanded ESEF. This is easy to portray as confusion, but it actually provides a great opportunity for investors.
- The PMI was 51.6, a very solid number. Most people do not understand the interpretation of this series. A reading of below 50 indicates a decline in manufacturing, but that sector has been declining for many years. A PMI of 42 or so is the breakeven for economic growth. The September reading is consistent with growth of 3.2%.
- Wholesale sales have been very strong. Check out Steven Hansen’s chart and analysis of the significance.
- Auto sales were strong, and better than expected. We highlighted this last week as a key factor to watch. Here is the chart from Ed Yardeni.

- Rail traffic hits a three-year high. Todd Sullivan writes (and check out his chart):
IF we enter a double dip, it will be the first time the US has ever done that with both increasing rail traffic and auto sales. Because of that, recession talked IMO, needs to be discounted even more especially given this data in conjunction with Sept auto sales coming in at 13.1M SAAR, GDP for Q2 being revised UP, ISM, ISI numbers still showing expansion and employment numbers grudgingly improving.
The Bad
There were also some negative events, although fewer than in recent weeks.
- Fitch cut credit ratings for Spain and Italy. Stocks sold off on the news. One might think that further credit downgrades are expected by the market, but the news always seems to get a reaction. With three main credit agencies and a host of potential downgrade targets, expect more of the same. Moody’s also downgraded several UK lenders.
- M2 growth has stalled, although it is still up big on a year-over-year basis. This stimulus in the pipeline should not be ignored.
- Action on the Jobs Bill is still stalled in the Senate. Despite changing the financing with the millionaire tax approach, the jobs plan does not have the needed votes in the Senate. I expect eventual Senate passage. The House, of course, is a different story.
- The technical picture is still weak. While key support held last week, the charts show continuing lower highs and lower lows. Charles Kirk’s weekly chart show describes what to watch for in the coming week.
- Home prices declined by 0.4% according the widely-followed CoreLogic report. While this was partly due to seasonal factors, Calculated Risk still expects the prices to reach a new low, as illustrated in this chart:

The Illusion
Some believed that market strength last week was the result of the potential for a corporate “tax holiday” permitting repatriation of profits with lower taxes. There is bipartisan support for the concept.
It is too soon for market enthusiasm on this score. If anything comes of this idea, it will (and should) be part of a larger package.
The Mixed Picture
Expectations for employment were so low that even a modest net gain over 100K was a relief to many
On the negative side we have the following:
- Net job gains that are too low to absorb new workers, a rate of about 125K per month — and much less than the 200K or so needed to reduce unemployment.
- Unemployment remained stuck at 9.1% and increased to 16.5% for the broader “under-employed” measure.
On the positive side, the continued employment gains are consistent with modest economic growth. Some commentators with a bias want to emphasize that part of the gains were the Verizon strikers returning to work. To make that argument, you should also be willing to adjust last month’s number when the striking workers were taken out. There are also continuing misleading comments from those discussing the BLS birth/death adjustment. No one seems to have noticed that the latest benchmark revisions showed that the BLS was under-estimating job creation by about 200K over the most recent year.
Bob Dieli does a monthly analysis of the employment situation report (graciously offered to our readers this month). He concludes that it is a “nice report” showing that the cycle turning point is “still some ways away.” This is independent confirmation of his cycle model results which we displayed last week. These suggested that the cycle peak was more than nine months away.
The Indicator Snapshot
It is important to keep the weekly news in perspective. My weekly indicator snapshot includes important summary indicators:
- The ECRI Weekly Leading Index and the derivative Growth Index has been dropped because it does not provide meaningful independent data. Past articles in this series have highlighted our concern over the last several months. See especially last week’s discussion.
- The St. Louis Fed Stress Index
- The key measures from our “Felix” ETF model.
The SLFSI reports with a one-week lag. This means that the reported values do not include last week’s market action. In my research, I take account of this lag. In my daily monitoring of the market I look at the underlying elements in the SLFSI. The SLFSI continues to edge higher, almost to my pre-determined risk alarm. This is partly the result of the VIX. Another rising element is LIBOR. The SLFSI is still not signalling the major calamity that many deem a foregone conclusion, but it is moving higher. This is an excellent tool for managing risk objectively, so we must respect the verdict — a slight reduction in the long-term portfolio size.
There will soon be at least one new indicator, and the current choices are under review.
Our “Felix” model is the basis for our “official” vote in the weekly Ticker Sense Blogger Sentiment Poll, now recorded on Thursday after the market close. We have a long public record for these positions.
We voted “Neutral” this week, but things are still pretty weak.
[For more on the penalty box see this article. For more on the system ratings, you can write to etf at newarc dot com for our free report package or to be added to the (free) weekly ETF email list. You can also write personally to me with questions or comments, and I’ll do my best to answer.]
The Week Ahead
There will be some interest in the FOMC minutes — the basis for the dissents and the potential for more aggressive Fed policy. I expect little from this.
Initial claims will provide more clarity about the recent apparent progress and potential seasonal effects.
The Michigan consumer confidence survey continues to have more importance than usual, since it captures many current themes about gas prices, employment, and reaction to politics.
Steven Hansen highlights the trade figures as relevant to recession forecasting, so we’ll watch that as well.
Most important should be the start of earnings season. Even if the Q3 reports are good, the punditry will pounce on any executive who has a vague or negative outlook. The evidence will accumulate a bit at a time, and it make take longer than this quarter.
Trading Time Frame
In trading accounts we were out of the market all week. We have shifted to a neutral vote on the market with a three-week time horizon. Nearly all of our ETF positions are in the Penalty Box, meaning that confidence in forecasts is low for us. It should be for you as well!
Investor Time Frame
In our ETF-based Dynamic Asset Allocation program, the portfolio remains very conservative. This cautionary posture includes bonds, gold ETFs, and utilities. It is conservative, but has no short positions at this time.
Long-term investors should buy and maintain core holdings of an appropriate size. This does not mean “buy and hold.” Investors who are staying the course have “right-sized” their positions and maintained confidence in their methods. With the increase in the SLFSI, a smaller position might be indicated. There continue to be many stocks that are attractive on an earnings or dividend basis, despite all of the fear.
I this article, I offered some suggestions on how the long term investor can take advantage of volatility.
The Recession Outlook
There was a lot of surprise about last week’s ECRI prediction of an inevitable recession and objections on several fronts.
The Wall Street Journal notes:
Economists downplay the WLI because of its high correlation with movements in the stock markets that have been volatile lately. Joseph LaVorgna, chief U.S. economist at Deutsche Bank, calculates a correlation coefficient of 90% between the WLI and the S&P 500 stock price index.
“Essentially, so goes the S&P 500, so goes the ECRI,” he says.
The WLI, however, is not the only hammer in ECRI’s toolbox, says Achuthan.
Corporate CEO’s also do not agree. Reuters notes contrary commentary.
A deeper analysis comes from Mike Dueker, whose Business Cycle Index is a leading candidate for inclusion in our Indicator Snapshot. He did a guest column for Econbrowser this week. The entire article is important, but here are some highlights:
…(T)he measures of financial market concern about the state of the economy that go into the Qual VAR model are not showing acute stress at present, especially relative to their values in late 2007 and and early 2008. For example, the TED spread between 3-month LIBOR and the 3-month T-bill rate has to consider that, since December 2008, the LIBOR yield has had a floor under it equal to the 25 basis point interest rate the Fed has been paying on excess reserves. Viewed this way, the current 3-month LIBOR yield of about 32 basis points in September 2011 does not represent much stress in interbank lending markets at all. Similarly, the Baa-Aaa corporate bond spread averaged about 120 basis points in September 2011, which is elevated, but still slightly below levels seen during the recession scare in June and July 2010. As a signal, the slope of the yield curve between ten years and three months is also distorted by the present near-zero interest-rate policy, which prevents yield-curve inversions. For this reason, the model also includes the level of the ten-year Treasury yield and core inflation to reflect the Japan-like near-zero long-term real return expectations on the Treasury bond.
Recessionistas who want to ignore all yield curve data should read the analysis again. It also suggests that the SLFSI may be over-stated.
Here is the history and forecast information from the BCI model.

This result is consistent with the other recession methods we are tracking.
(c) New Arc Investments
www.newarc.com
Email Jeff


