Courtesy of Joshua Brown, The Reformed Broker
You know my friend JC at All Star Charts? He's nasty with the Fibonacci stuff and his inter-market work as well. But his number one set-up – the one I hope he writes a book about one day – is the Failed Move-Fast Move. The theory is that when a breakout or breakdown fails and everyone is leaning the wrong way, there is an extremely fast counter-trade to be had – and the bigger the false move, the faster and more aggressive the stock moves in the other direction. And JC sniffs these things out and exploits them like some kind of a demonic wizard in a golden cloak – I've known him for 7 years and seen quite a few of these in real-time.
Anyway, JC has an epic post up that I'm republishing below because it think it's really exciting. He sees the potential for a March '09-style final puke-up in Nat Gas ($UNG) that could be the mother of all false breakdowns. Nat gas, for the casual observer, is down over the last 5 years from 13 to 2! The bear trend has been relentless and a capitulatory bottom may very well be at hand if certain things line up – here's JC on how a counter-trade may work if that final breakdown fails, enjoy!
***
It’s looking like fresh lows are in the cards for nat gas. Where is the bottom? When is the blood bath over?
We’re going on over 3 1/2 years of destruction and 80% losses. There is an old saying on Wall St. that, “Bottom Fishing can be Hazardous to your Wealth”. If you didn’t know this, let the current state of Natural Gas and the ’08 Financials be a lesson.
But in this case, we’re not talking about a company that can go bankrupt right? This is a commodity after all. So the reversion to the mean process should begin at some point. But where and when?
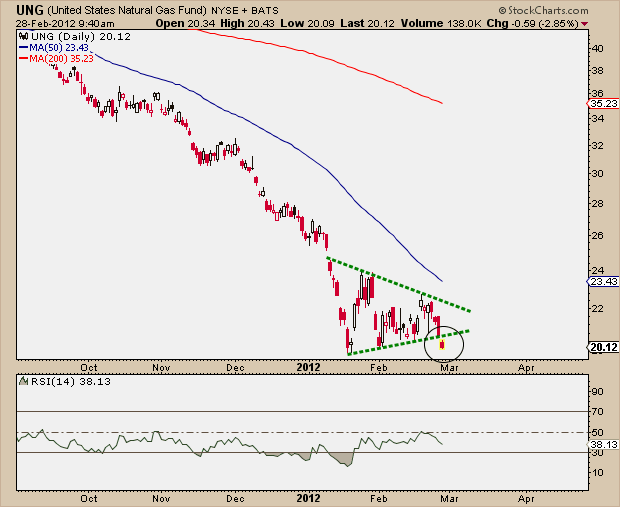
Take a look at the recent consolidation in the United States Natural Gas Fund ($UNG). The breakdown here below the triangle is typical. This type of brief pause usually resolves itself in the direction of the underlying trend. In this case it is clearly down. As scary as it may sound, the 4 point base in the triangle gives us a target somewhere in the 17.50 area. We may not get that low, and we can just as easily go even lower. But I have a feeling that a vicious tradable rally will develop from this breakdown.
As Natural Gas makes fresh lows and pessimism in this space makes fresh highs, the right pieces are in place for a Rip-your-face-off rally. But let the trade come to you. Let it develop. It’s been about 45 months, so what’s another couple of weeks or days?
Look at the extreme lows recently put in RSI in the chart above. As $UNG makes new lows in price, I would want to see a higher low made in the Relative Strength Index. This potential bullish divergence could spark the rally. But we’re not there yet. We’re looking at a 17.50 target where we can start looking for entry points, but it could come sooner. A key reversal day would not surprise me. Perhaps a day where Nat Gas sells off early and rallies back hard in the afternoon? Or maybe a big gap lower after a weekend with a solid all-day rally throughout Monday. There are a few different scenarios that could work out here, but the most important thing to remember is that we are looking for the smallest amount of risk. We want a point of reference to help us manage risk with stop losses or put options.
The idea here is to find a risk/reward where we can risk less than 4-5% with the potential to get back to the mean. In this case, a 200 day moving average that could be twice the value of the entry point. And remember that we are in a reversion beyond the mean business. In other words, we typically see prices exceed the mean. So the potential here is huge. The difficult part is the risk management in a crashing security. That is where the patience comes in.
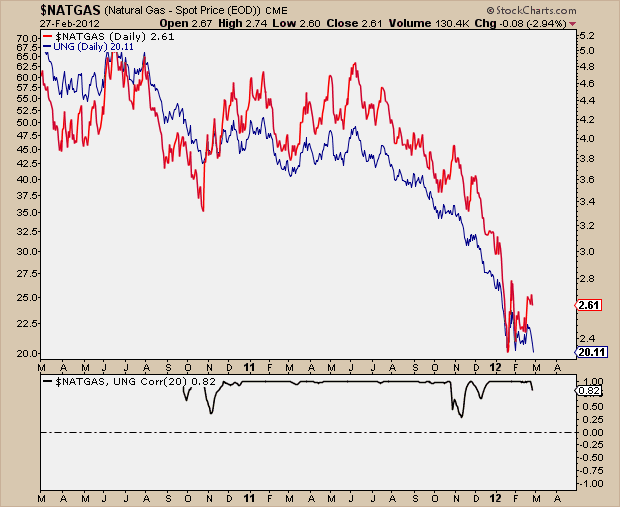
And now for the $UNG haters (everyone hates this ETF). It is a disliked vehicle for good reason – all it does is go down. I’ve never seen anything like it. But at the end of the day, it’s liquid and is very highly correlated with the commodity itself. So if we’re looking for an equity vehicle to trade this space, $UNG will have to do. Look at the very positively correlated $UNG & $NG_F:
So I’m going to be patient. No positions yet and don’t plan on initiating anything yet. But the face-ripper will come. Stay tuned….
Source:


