

New House Sales Show Continued Improvement
From Historically Miserable Level
Courtesy of Lee Adler of the Wall Street Examiner
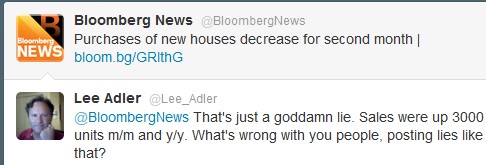
While the media was touting a miss on consensus expectations, and Bloomberg posted an outright lie on Twitter, the actual unadjusted data showed a big improvement over the year ago performance.
That’s not saying much, considering the rock bottom levels this is starting from, but nevertheless, addition is better than subtraction. No matter how small, any increase at all from these levels is a net add for the US economy. Unfortunately, at this rate of improvement, it will be a very long time before most Americans feel any benefit.
Here are the quick facts. Sales were 25,000 in February vs. 22,000 in February 2011. The month to month change was a gain of approximately 14% vs. 5% in 2011. The media touted a miss of economists’ consensus expectations. What else is new? Economists guesses nicely fit a random distribution. They are worthless and most experienced traders know that.
The bigger problem with the reports was that they indicated that sales were down, which is false. They were using a completely fictional, meaningless, seasonally adjusted number that has no basis in reality. The actual number was up versus January and up versus 2011.
It is important to note that these numbers are based on a small sample survey, have a wide margin of error, and are subject to big revisions in ensuing months. On the other hand, it is rare that a reported gain is subsequently revised to a decline in ensuing months.
The headlines touting a decline are flat out wrong, misleading, and disingenuous. The Commerce Department also reports the actual, not seasonally adjusted numbers. Apparently, mainstream media reporters and editors are too lazy and/or too dishonest to report them. Bloomberg is usually among the worst offenders in this regard. It is unconscionable that the mainstream media continue to report the bogus seasonally adjusted number while completely ignoring the actual number. If they are going to report one of the numbers and not the other, the least they can do is report the actual number and do a little analysis. It’s not that hard. A 6th grader could do it. I should know, given my level of education.
We do have to be careful because this data is based on sales contracts. To that extent, it’s a good barometer of relative demand, but we also know that large numbers of sales are falling through. The NAR reported a contract failure rate of 31% of existing house sales in February versus 9% last year. I doubt that builder sales blowups are that high. Builders should be far better prepared in terms of having any problems with appraisers, and they are likely to have done a better job of qualifying buyers than Realterrors do. On the whole, I would guess that final sales will be a little better versus last year. It’s not much, but it’s better than media reports are representing.
Additional data shows that the actual inventory to sales ratio was 6.0 in February vs. 8.2 in February 2011. That’s a huge improvement. Did you see that reported anywhere? I didn’t think so.

The big jump in the NAHB builder survey was not matched by the increase in sales. Either builder perceptions are distorted, or the Commerce Department missed something. Next month’s data should be enlightening.

Reported contract sale prices jumped in February and they are now up 6.2% versus last February. Median reported sale prices have been making higher lows for 2 years, but they have yet to break out to higher highs versus the peak levels of the past 15 months. While prices seem to have bottomed, it is not clear yet that they are headed higher.

We should note that these minimally improved levels of pricing are happening at a much lower level of supply and sales volume than were considered normal in the past. There’s potential for pricing leverage on even a small increase in effective demand.
That’s a condition that may be hard to meet, with slow growth in full time employment, and most of that growth in low wage jobs. But just last week I saw an ad from a large Florida builder screaming at buyers to beat the price increase coming in April. It’s been about 5 or 6 years since I have seen one of those, but it suggests that with the low levels of inventory pricing power may be returning to some more active markets where prices have cratered.
I’ll cover that in more detail along with a wide variety of other housing indicators in the next Professional Edition housing report in early April.
Get regular updates the machinations of the Fed, Treasury, Primary Dealers and foreign central banks in the US market, in the Fed Report in the Professional Edition, Money Liquidity, and Real Estate Package. Click this link to try WSE’s Professional Edition risk free for 30 days!
© Copyright 2012, The Wall Street Examiner Company Inc. All rights reserved.
Attention third party re-publishers: This article may be reposted only in its entirety with a prominent link to http://wallstreetexaminer.com or other page on this website. Any changes to the article, or other use without the expressed written consent of Lee Adler is unauthorized.