

Courtesy of Mish.
Here are some charts from Reader Tim Wallace that help explain my report a few days ago that 23% of Small Business Owners (Approximately 6.21 million) Report “No Pay for a Year”; New Zealand, Singapore, US, Best Places to Start and Run a Business
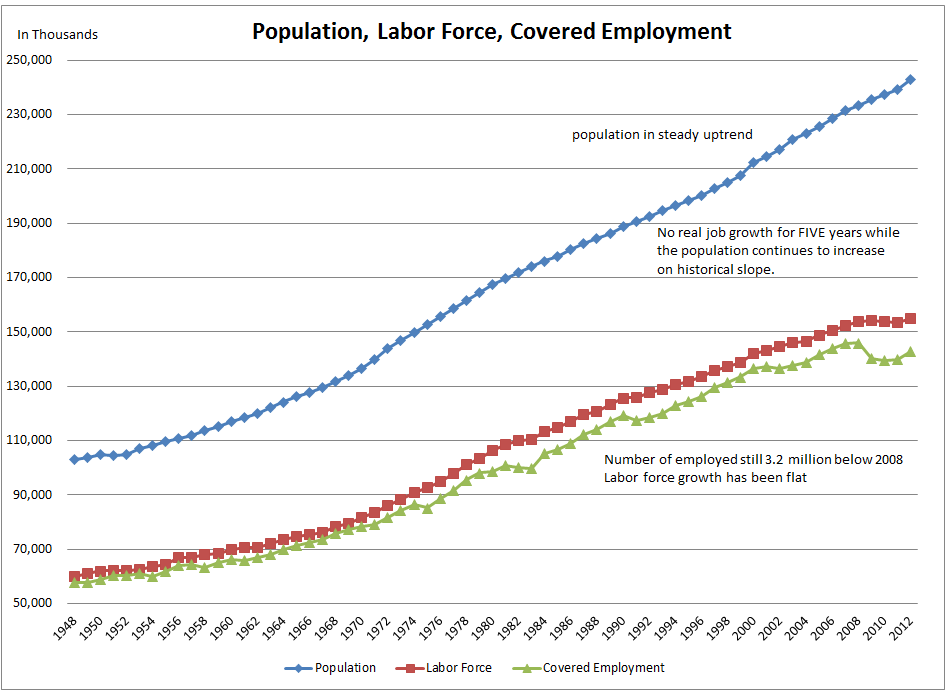
The first chart below shows actual employment of covered workers compared to the civilian population and labor force. Covered employees are those eligible for unemployment benefits (working or not). Some are currently collecting those benefits.
In the following charts, “covered employment” or “net employment” refers to those with benefits and currently working.
Population, Labor Force, Covered Employment
click on any chart for sharper image
Self-employed workers and contractors are not eligible for unemployment benefits even though they have to contribute to state unemployment insurance schemes. It believe it is government-sponsored fraud to have to pay unemployment insurance when there is no chance of ever collecting it.
The next chart shows state level employment data. Net covered employees (those currently with a job covered with unemployment benefits) was calculated by subtracting continuing unemployment claims from the pool of all covered workers….