Courtesy of Lee Adler of the Wall Street Examiner
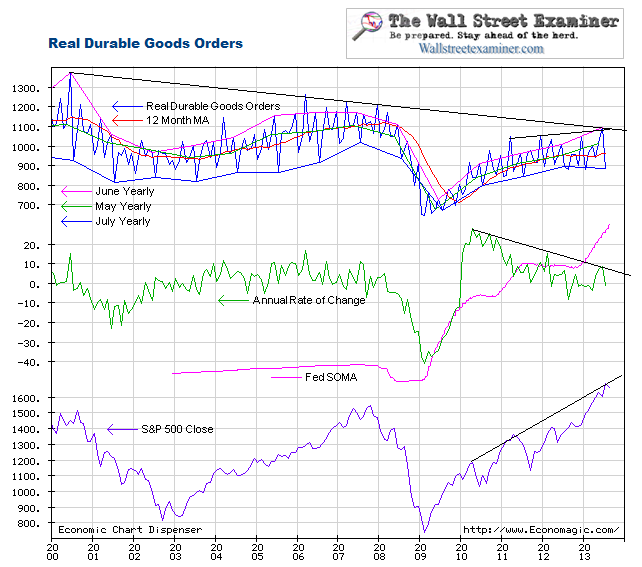
(8/26/12) July Real Durable Goods Orders, adjusted for inflation and not seasonally manipulated, were up 5.3% over July 2011. That compares with a 3.8% year to year gain in June. The growth rate is increasing. In adjusting for inflation, this measure attempts to represents actual unit volume of orders. Also, the use of actual, versus seasonally adjusted (SA) data allows an accurate view of the trend. With SA data, this may not be the case, since SA data can overstate or understate the real underlying change by attempting to fit the data to a standardized curve. There are no such issues when using the actual data (see Why Seasonal Adjustment Sucks).
Overall new orders volume remains well below the 2004 through 2007 levels, and the uptrend has slowed from the dramatic rebound of 2009-10. However, 5.3% growth is strong. The average July change over the previous 10 years was a drop of 15.4%. This year’s change was better than both the last two years and much better than the 10 year average.
July is always weaker than June and the lowest point of the year in this series. This July was down 10.4% from the June level. That compares with a drop of 11.7% in July 2011 and 12.7% in 2010. The headline number reported in Friday’s media reports was a 4.2% gain month to month, SA. That beat ’conomists consensus of 2.5%.
On a quarterly basis, the July level of orders is usually below the April level. This year the July level was down just 1.1% versus March. The average difference for July versus April over the previous 10 years was a drop of 7.4%. Last year it was 2.5% and in 2010 it was 5%.
The data is quite volatile month to month but you can see on the chart that the trend is consistent with the last 18 months.
As usual, they were looking at the wrong data. The real time withholding tax data showed the economy gaining ground in July. As a result we were expecting the economic data to consistently beat consensus for the month of July, which is, in fact what happened. Responding to the numbers coming in stronger than they had expected, Wall Street ’conomists raised their forecasts for August, but the August withholding data suggests that they will get whipsawed yet again.
This report is an excerpt from the permanent page for Durable Goods and Factory Orders charts, updated when new data becomes available. You can bookmark that page for future reference.
Get regular updates the machinations of the Fed, Treasury, Primary Dealers and foreign central banks in the US market, in the Fed Report in the Professional Edition, Money Liquidity, and Real Estate Package. Click this link to try WSE's Professional Edition risk free for 30 days!
Copyright © 2012 The Wall Street Examiner. All Rights Reserved. The above may be reposted with attribution and a prominent link to the Wall Street Examiner.


