

Courtesy of Mish.
Assuming the BLS projections for the labor force until 2020 are correct, what will the unemployment rate look like for the rest of the decade?
Background for this question comes from two prior posts.
- About That “Expected” Drop In Participation Rate
- Charting Errors in BLS Participation Rate Projections
Those posts show just how badly the BLS missed prior projections of the participation rate. Consider this chart of 2006 projections vs. 2012 projections from the second link above.
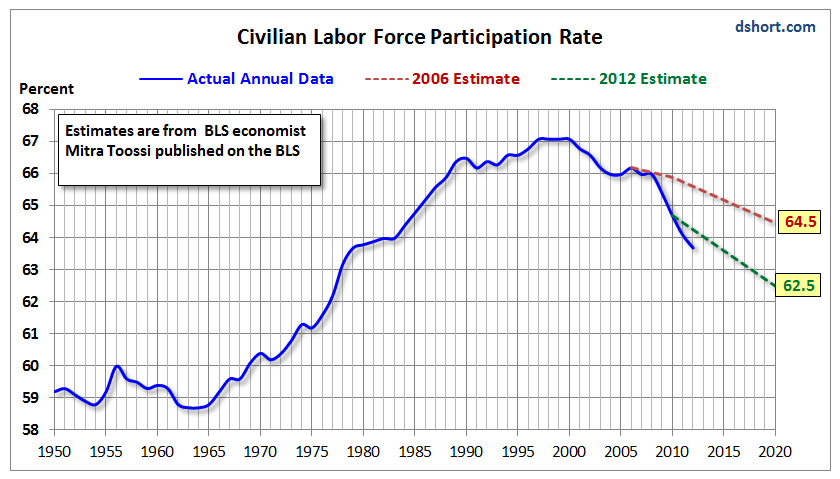
click on chart for sharper image
Chart Data
Mitra Toossi in November 2006: A new look at long-term labor force projections to 2050
Mitra Toossi in January 2012: Labor force projections to 2020: a more slowly growing workforce
I asked Doug Short at Advisor Perspectives to plot the difference as a follow-up to my post About That “Expected” Drop In Participation Rate.
Looking Ahead
Assuming labor force and participation rate projections made by Toossi in January 2012 are now correct, the determining factor is job growth.
…