Courtesy of Lee Adler of the Wall Street Examiner
The BLS today reported a seasonally adjusted (SA) gain of 236,000 in February nonfarm payrolls. This massively beat consensus expectations of a gain of 165,000, in surveys of economists. However, it should have come as no surprise, especially after Wednesday’s release of the ADP data.
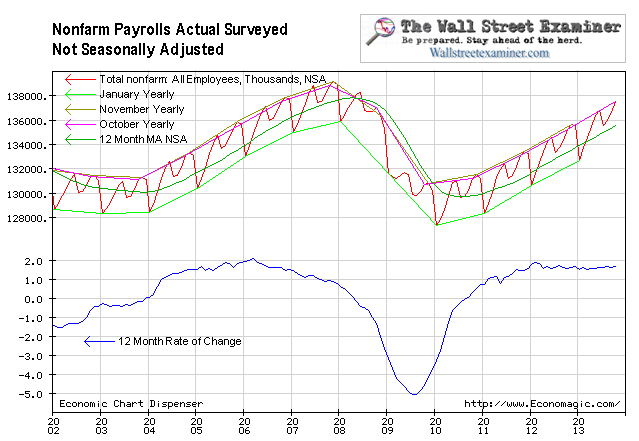
The SA number compared with a gain of 959,000 in the actual, not seasonally adjusted number (NSA). Since this number is not seasonally finagled we must look at past years to judge whether it’s good, so-so, or lousy. Last year the February NSA gain was 947,000. In 2011, it was 816,000. The 10 year average increase for February 2003 to 2012 was 593,000. This year’s number was better than all of the past 10 years. This was a good top line number in terms of the recent context. But the devil is in the details, and the details that matter are full time jobs. In that respect there was a problem.
The NSA number is not massaged to represent an idealized curve with seasonal tendencies filtered out. Once again this month, the actual data was smack on the trend of the past year. The number of jobs has been growing at virtually the same rate for the past 18 months, around 1.5% per year, give or take a tenth or two. There’s nothing profound or new here, and therefore no reason to think that the markets will change course. Nor is there any reason to think that the Fed will change policy any time soon. The growth in jobs is tracking population growth, therefore there has not been, much reduction in the unemployment rate. The guessing that the Fed will end QE any time soon is just a guess, and it’s just what the Fed wants speculators to be thinking about, lest they go wild driving gold and energy prices higher.
The numbers above come from the BLS the Current Employment Statistics Survey or CES, a survey of business establishments. The BLS also does a survey of households. To complicate matters, the household survey or CPS — Current Population Survey– often tells a different story from the establishment survey.
The CPS February is a month in which the actual NSA number also usually increases. This year the number of persons reported as employed in February rose by 614,000 from January. That compares with a rise of 740,000 in February 2012 and 494,000 in February 2011. The average change in February for the previous 10 years was an increase of 336,000. This year was better than the average. It was better than 9 of the 10 prior years coming in behind only last year. This sounds great, but the problem is that most of the gains are in part time jobs.
The year over year gain in total employment under the CPS was 1.54 million or 1.1%. Over the prior 12 months the annual rate of change had fluctuated between 1.2% and 2.2%. The 1.2% was in January, and in February that slipped to 1.1%. This data suggests a slowing in employment growth momentum. The growth rates were actually stronger before the Fed started pumping money into the economy when it settled the first of its QE3 MBS purchases in November.
Here’s where we get to the problem. Full time employment growth is badly lagging total employment. Part time jobs are nice, and for many that hold them, they are a lifeline, but the important metric here is full time jobs. Without those, we’re dead.
Full time employment in the CPS rose by 323,000 in February. February is typically an up month for full time jobs. Last year full time jobs rose by 708,000 in February, and in 2011 they rose by 358,000. The 10 year average increase in full time jobs for February was 216,000, pulled down by a big negative number in 2009. Excluding that year, the average would have been 336,000. This year’s gain was short of that average and was better than only 4 of those 10 years, as well as weaker than the last 2 years. This is bad news. The anecdotal reports that there aren’t enough good jobs out there are supported by these numbers. QE3-4 is not helping. The market did better last year when the Fed was in a QE pause.
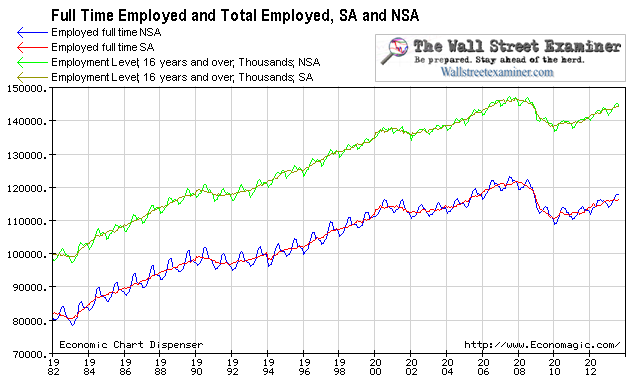
The chart above gives some perspective on how far total employment and full time employment fell in the first stage of the 2008-09 depression, and how much they have yet to recover.
Job gains accelerated in 2012 versus 2011, but throughout 2012 the rate of gain in full time employment stabilized around a 2% annual rate, ranging from +1.7% to +2.2%. Then in February the rate dropped sharply to just 1.4%. With QE3 in late 2012, the Fed began adding more fuel to an engine that was running at its natural capacity. Job growth has not responded to the flood of money printing. While house prices and stock prices are rapidly inflating, thanks to too many dollars chasing too few assets, job growth has essentially stalled at the rate of population growth.
The Fed is blowing massive asset bubbles while the economy plods along at the same growth rate it would have had without all the extra cash flooding the financial markets and housing market.
Stock market performance is at the mercy of the Fed, and employment typically reflects them both. While at times there’s a lag, the linkage is there. By cashing out the Primary Dealers via MBS and Treasury purchases, the Fed enables the dealers to buy more Treasuries. The next week, the Treasury spends that cash. That’s how the Treasury debt Ponzi scheme is immediately transformed into economic activity and, theoretically, job creation. The Fed also prays that an increased “wealth” (really inflation) effect from rising asset prices will increase consumer spending, the hoped for trickle down effect of the Fed’s securities purchases. But the economy can only respond so far. This month the transmission mechanism between extra monetary stimulus and job growth has failed.
With QE3 and 4, the Fed is adding even more cash to power that trend. The first settlements of the new MBS purchases made in September took place in the week of November 14-20. The Fed settles each round of MBS monthly around mid month. The Fed’s QE 4 Treasury purchases began in January, and settle daily. The Fed had hoped that all this additional stimulus would show up in the jobs data. 5 months after the implementation of QE3 and 3 months after the cash from the program began to flow into the economy, full time job growth has suddenly radically slowed. It was doing better when there was no QE in 2011 and 2012.
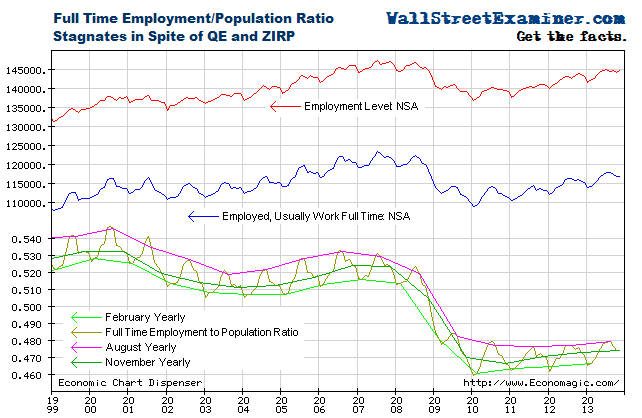
The chart below shows that while the number of jobs is growing, the employment to population ratio has barely budged since the recovery began in 2009. The economy seems only to be keeping pace with population growth. The full time employment to population ratio bottomed at 46% in January 2010, and it’s at 46.5% today.
Top line growth may satisfy the markets, but it is doing next to nothing to help the massive army of people who have been and continue to be unemployed. Their numbers are growing right along with the number of people who do have jobs. It is a sad state of affairs for the US, but markets don’t care about that. As the chart above shows, they respond to the amount of cash in dealer accounts, which, thanks to the Fed, continues to grow.
Get regular updates the machinations of the Fed, Treasury, Primary Dealers and foreign central banks in the US market, in the Fed Report in the Professional Edition, Money Liquidity, and Real Estate Package. Click this link to try WSE's Professional Edition risk free for 30 days!
Copyright © 2012 The Wall Street Examiner. All Rights Reserved. The above may be reposted with attribution and a prominent link to the Wall Street Examiner.


