

Courtesy of Declan.
I have added a new market sentiment chart with relative momentum, trend and volume metrics in the one chart. As an example in the new chart, industrials (XLI) gained Thursday and Friday, but these gains were delivered with a drop in momentum, cooling volume and a weak bullish trend.
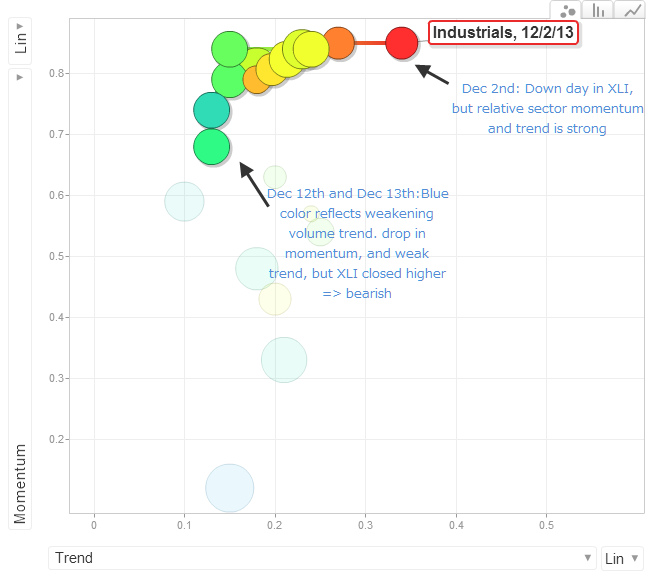

The Relative Momentum, Trend and Volume Chart:
In terms of the relative relationship between price change and bullishness, Industrials experienced a sharp drop in bullishness which failed to recover during the Dec 4th – 10th bounce. It looks like further downside is on the cards – at least until Bullishness drops below the 10% level, which is usually a good near term buying proposition.

Net sum: Industrials look to offer better a better short-side play over the coming days.
—


