

Courtesy of David Stockman of Contra Corner
This morning I had left the TV mistakenly tuned to CNBC with the sound on – and unavoidably caught another bullish strategist jawing about the US economy’s awesome strength. This one was peddling as exhibit #1 the recent surge in C&I loans, arguing that it is a sure sign that business is gearing up for a post-winter boom.
It turns out that the $1.8 trillion of C&I loans outstanding at the end of February, in fact, were up by 14% since January 2014. But then again, when are they going to find a guest which wasn’t born yesterday. That is to say, an analyst who is capable of looking at the historic context in which the latest data points are anchored, the quality of the numbers at issue and the deeper implications of the indicators.
In this case, like most of the blizzard of bullish factoids spewed out each day on bubble vision, the purported business lending boom is not all that. The upward blip during the last 13 months was from a level which had first been reached way back in October 2008. In other words, it had taken 63 months to dig out of the deep crater that had resulted from the liquidation of the mountains of bad debt that existed on the eve of the financial crisis.
![]()
Next consider the quality and content of the purported “surge” in business lending. The skunk in the woodpile is patently obvious in the graph below.
The “surge” is almost entirely due to financial engineering and LBOs. In fact, virtually all of the growth in business lending during the past two years is due to a dramatic rise in leveraged loans from the deal business. Thus, overall C&I loans are up a modest $220 billion since October 2008, but 100% of that gain is accounted for by the 37% rise in leveraged loans outstanding since 2008.

Needless to say, even a quick peak under the hood results in just the opposite conclusion to that offered by CNBC’s bull peddler of the day. Back in some dusty economic textbook a few decades ago, it might have plausibly been argued that rising C&I loans were evidence of business expansion and a rising requirement to fund working capital and plant and equipment.
But after two decades of central bank financial repression and grotesque mis-pricing of debt, we now have an irrational scramble for yield which is actually attracting funds into anti-growth, anti-jobs and capital destroying deployments—-the opposite of the historic implication of rising business lending.
The fact is the LBOs and leveraged recaps which utilize this booming leveraged loan market invariably involve the strip-mining of cash out of enterprises in order to pay debt service, not the acquisition of new productive capital. Stated differently, this is Wall Street driven lending that arises not because businesses need funding for productive assets, but because speculators, money managers and banks desperately need “yield” in their portfolios.
Accordingly, the proceeds from such loans are more or less put to happenstance use—-and invariably end up as dividends and fees to the private equity shareholders of the leveraged borrowers.
The graph below provides the smoking gun evidence that the recent upturn in reported C&I loans is yield driven. To wit, the recently surging volume of leveraged loans was being taken down by a recrudescence of the CLO market (collateralized loan obligations).
After being essentially shutdown during the financial crisis and for several quarters thereafter, CLO issuance has come roaring back. This was especially the case after mid-2012 when the Fed’s monster QE programs drove treasury and investment grade yields toward the zero bound.
The truth of the matter is that in an honest free market, financial engineering contraptions like CLOs would not even exist. These are essentially “pop-up” funds that appear out the bowels of Wall Street when the Fed’s serial financial bubbles reach an advanced stage. They involve issuing debt to buy debt with some internal fund-level leverage thrown in to top-up the returns.
Stated differently, CLOs are just another financial arbitrage play in which the fast money scalps a cut out of pointless financial churning. These CLO funds are essentially artifacts of financial technology that provide no value added to the economy; and, when the inevitable main street downturn arrives, they disappear as fast as they came in a hail of write-offs and investor losses.
The only thing CLOs actually add to the financial system is instability. In fact, CLOs embody the very worst kind of liquidity and maturity mismatch. The underlying whole loans are hard to sell and have 5-7 years terms. By contrast, CLO debt is sold by Wall Street in a “bespoke” market. That is, the yield parched investors who get suckered into buying these securities are free to sell them at will——but invariably into a dealer market which “gaps” massively downward when the panic starts.
So rather than looking at the financing input into the main street economy, it would be far more sensible to look at the output. Namely, the rate of investment in new productive assets that will support productivity and output growth in the future.
Needless to say, there is none. The massive distortion and deformation of financial markets fostered by the Fed is encouraging the liquidation of American business, not its expansion. As shown below, after accounting for the depreciation of assets in current production, real net investment in American business has not even yet recovered to its 1999 level.
Net Real Domestic Business Investment
So the real story is not about business investment growth but about financial engineering. In that regard, the Wall Street claim that American business is healthier than ever before and is sitting on mountains of cash just waiting to be put to work is rank nonsense.
Yes, non-financial business have generated about $500 billion in additional cash since the financial crisis. But, on the margin, that was all borrowed money—since total credit market debt outstanding is up by nearly $2 trillion during the same seven-year period. Overall, the net debt of American business is at its highest level in history.
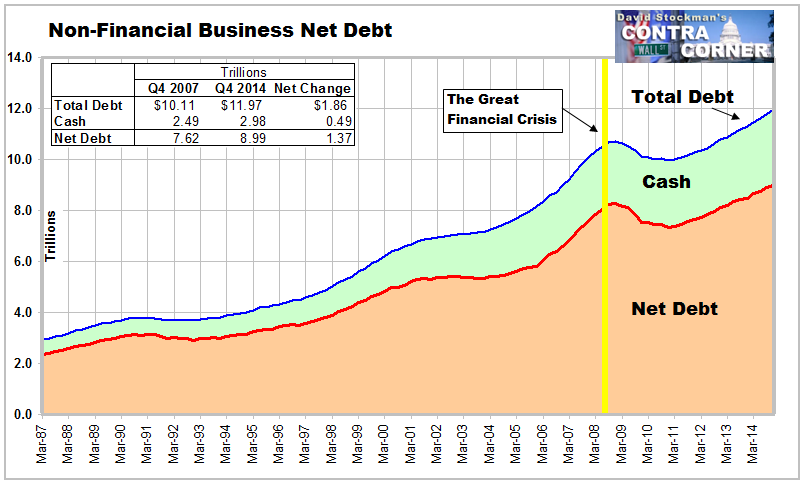
Non Financial Business Net Debt
One of these days, even the Wall Street bulls are going to be compelled to look under the hood of their happy time numbers. The story above is only a mild example of what they will find.