

Courtesy of David Stockman via Contra Corner
The robo-traders – both the silicon and carbon based varieties – were raging again yesterday in celebration of a “goldilocks” jobs report. That is, the headline number for April was purportedly strong enough to sustain the “all is awesome” meme, while the sharp downward revision for March to only 85,000 new jobs will allegedly enable the Fed to kick-the-can yet again – this time until its September meeting. As one Cool-Aid drinker put it,
“Probably best scenario in which the market was hoping for growth but not (so strong) that the Fed needs to hike in June,” said Ryan Larson, head of U.S. equity management at RBC Global Asset Management (U.S.).
Yesterday’s knee jerk rip, of course, is the fifth one of roughly this magnitude since February 20th, but its all been for naught. The headline based rips have not been able to levitate the S&P 500 for nearly three months now.

In fact, however, the incoming data since February 20 has been uniformly bad. The chop depicted in the graph, therefore, only underscores that the market is desperately churning as it attempts to sustain an irrationally exuberant high. Indeed, today’s jobs data was not bullish in the slightest once you get below the headline. Specifically, the number of full-time jobs dropped by 252,000 in April—–hardly an endorsement of the awesomeness theme.
True enough, the monthly number for this important metric bounces around considerably. Yet that’s exactly why the algo fevers stirred by the incoming data headlines are just one more piece of evidence that the stock market is completely broken. What counts is not the headline, but the trend; and when it comes to full time jobs there are still 1.1 million fewer now than at the pre-crisis peak in Q4 2007.
![]()
Needless to say, a net shrinkage of full-time job after seven and one-half years is not exactly something that merits a 20.5X multiple on the S&P 500 or 75X on the Russell 2000. That’s the case especially when that same flat lining jobs trend has been underway for nearly a decade and one-half. To wit, since April 2000 the BLS’ full time job count has grown at only 0.35% annually.
Now how in the world do you capitalize earnings at a rate which implies gangbusters growth of output and profits as far as the eye can see, when the US economy is self-evidently trapped in a deep rut that represents a drastic downshift from all prior history? Thus, compared to the 0.35% rate since the turn of the century, full-time employment grew by 1.8% per annum during the prior 15 years.
When a trend rate downshifts by 80%, you just aren’t in Kansas any more—even if Keynesian economists and MSM financial journalists don’t know it. On that score, MarketWatch’s headline says it all:
“Jobs growth is ‘back on track,’ economists say after payrolls report”
The problem is that they blithely assume its the same old, same old cyclical track diagramed in the Keynesian textbooks of yesteryear. Well, let’s see. Between 1985 and 2000, the adult civilian population (16 years +) grew by 34 million and the number of full time jobs increased by 26 million or by fully 76% of the population gain.
By contrast, during the fifteen years since the turn of the century, the adult population grew from 212 million to 250 million, but the number of full time jobs rose by only 6.2 million. In short, the nation gained 38 million more adult consumers, but only 15% of them have been employed as full-time producers. And that dismal trend is guaranteed to get worse because its baked into the demographic cake. That is, today’s 45 million retirees will become 75 million less than two decades down the road.
In welfare state America its virtually certain that through one artifice or another taxes will go up and the national debt burden will rise to crushing heights in order to keep the baby boomers’ entitlements funded. While Keynesians and Wall Street stock peddlers are clueless about the implications of this – it actually doesn’t take too much common sense to get the drift. Namely, under a long-term path of fewer producers, higher taxes and more public debt, the prospects for rejuvenating the previous historically average rates of real output growth are somewhere between slim and none – to say nothing of the super-normal rates implied by the markets’ current bullish enthusiasm.
As we explained a few days ago, the growth rate of the US economy is in a profound downward trajectory. Based on even the deficient national income and products accounts (NIPA), the growth of real final sales has dropped from 3.6% per annum during the golden era of 1953-1971 to only half that level or 1.8% since the year 2000, and to only 1.1% since the pre-crisis peak in late 2007.
So absent the Fed massive money printing campaigns since 2000 and the resulting drastic falsification of financial prices, cap rates or PE multiples would be going down, not stretching into the nosebleed section of recorded history. But in a central bank driven casino, there is no honest price discovery or discounting of the forward prospects for business growth and profits. The only thing that is actually “priced-in” is the expected short-term actions by the FOMC—–where today the consensus quickly concluded that the dreaded day in which carry trade gamblers would be required to pony-up the onerous sum of 25 bps for their chips would be deferred until September.
The level of simple-minded complacency that the Fed’s suffocating dominance of Wall Street has generated was well expressed by Diane Swonk, one of the CNBC economist cheerleaders:
“The porridge is still too cool from my perspective and certainly from the Fed’s perspective and that’s why you are not going to see a June rate hike,” she said on CNBC’s “Squawk on the Street.”
Call this the poison of Keynesian incrementalism. Monetary central planning channels the narrative emanating from Wall Street into a constrictive one headline/one month at a time framework that is utterly devoid of context and history. Accordingly, today’s “goldilocks” chatter is no different than that of 2007 or 1999. It implied that the business cycle would never end, and that none of the self-evident structural and short-term headwinds, as readily evident today as they were at the two previous cyclical inflection points, even exist.
Stated differently, the Cool Aid drinkers who rationalize the markets liquidity-driven bubbles, are about the closest thing we have in this day and age to children dressed in adult garments. They appear to naively believe that the party will never end and that the Fed somehow has finally gotten it right and has extinguished the business cycle once and for all.
In fact, the current business cycle is getting long in the tooth and the Fed has crab-walked itself onto the far end of a limb. At 70 months of age, the current recovery is already well beyond the 60-month average of the nine previous business cycles since 1950.
Moreover, even the 60-month average is flattered by the extended cycles of the 1980s and 1990s. But these were one-time runs that reflected a domestic credit boom that can’t be replicated in an era of peak debt; and a global growth boom fueled by money-printing EM central banks which was the exact macroeconomic opposite of the current deflationary global environment. Accordingly, the odds that these extended cycleses can be duplicated are laughably low—-nay, non-existent.
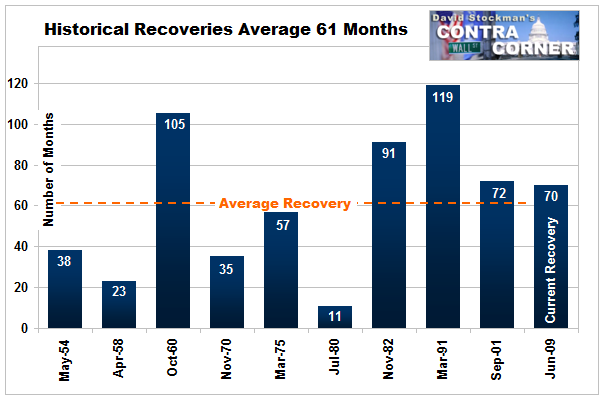
Length of Recoveries – Click to enlarge
Even apart from the structural headwinds, there is the simple matter of short-term mechanics. Owing to the bullish feasting on stock option winnings that is now rampant in the C-suites, corporate business has been building inventories at a ferocious rate during the last two years, culminating in the record $122 billion gain in Q1——an aberration that will surely reverse and cause a liquidation of reported GDP in the quarters just ahead.
Indeed, based on the Atlanta’s Fed’s deadly accurate Nowcast projection, it is likely that economic growth will record something close to a “stall speed” rate of growth at under 1% during the first half. And even that assumes no sudden, sharp liquidation of bulging inventories that already reflect the highest ratio against business sales since October 2008.
![]()
So the weakest recovery in modern times is on the verge of stalling out at a point in the business cycle when it is already long-in-the-tooth on a calendar basis. That hardly merits record valuation multiples, but then Wall Street is not capitalizing the future; its simply frolicking on the Chuck Prince dance floor under the false impression that the music will never stop.
As evident as that is at the macro-level, it is even more dramatically apparent in the surreal world of momo stocks. In the bottled air category, Tesla ended the week with about $30 billion of market cap, and up 5% for the week and nearly 30% since its last earnings report.
And, no, it did not surprise to the upside—-notwithstanding the usual “ex-items” gamesmanship:
The company lost 36 cents a share in the first quarter, less than the 49-cent loss estimated by analysts. Tesla shares rose 2.8 percent to close at $236.80, the highest in more than five months.
In fact, Tesla’s Q1 net of negative $154 million and ($1.22) per share was its worst on record—–a record that comprises an unmitigated flow of losses since it began filing with the SEC in 2007. Of course, that’s GAAP accounting income—-apparently a matter of no import whatsoever when Wall Street’s equivalent of the “vision thing” is at issue.
But here is the real thing. In a world saturated with excess automotive capacity and dominated by some of the most formidable engineering, manufacturing and marketing organizations on the planet—Toyota, BMW and Ford, to name just three—–there is no way that an amateurish circus barker like Elon Musk will ever make a profit selling electric vanity cars to the 1%.
In any event, what was relevant about this week’s (un)earnings release was that Tesla burned $570 million of cash in the just completed quarter alone. And needless to say, that’s exactly par for the course—–after it reported free cash flow of negative $450 million in Q4 and negative $330 million in the quarter before that. In fact, during the 21 quarters since 2010, when Goldman flogged its IPO, Tesla has reported negative free cash flow of $2.7 billion (i.e. cash from operations less CapEx and investments).
That number is not at all accidental. During the same period Tesla has raised $2.8 billion in the public debt and equity markets, net of its $465 million “early” repayment of its government loan.
In short, Tesla is a cash burn baby. Like much else on the leading edge of the Fed’s third and greatest bubble of this century, it is providing absolutely nothing that the market is willing to pay for—–and that is even after giving effect to more than $1 billion of green energy credits that have been booked by both the company and its affluent customers.
You might describe Tesla as $30 billion of capitalized hopium, but that would be too generous. In an honest free market, Tesla would have long ago been carted off to the chapter 11 junk shredder.
It lives for another day, however, because the sick puppy known as Wall Street has not yet stopped yipping.