

By Dana Lyons

On the other hand…
In a post the other day, we mentioned that often times when constructing an investment strategy, a money manager is faced with having to parse data inputs that are diametrically opposed to each other. We didn’t realize at the time that the Charts Of The Day for these past 2 days would offer a prime example of that situation. Yesterday, we noted that according to the Federal Reserve’s quarterly Z.1 release, the % of household financial assets that is invested in stocks is at 2007 peak levels.
Today, we show a different story from the American Association of Individual Investors via their survey on members’ asset allocations. For the month of May, the AAII reports that the % of members’ allocation to stocks dropped over 10 percentage points, from 67.9% to 57.8%. That marks the largest monthly drop in over 9 years, and an especially eye-opening move for a normally fairly stable series.
(Note: This is not the AAII weekly sentiment survey which can be extremely volatile. Data from the AAII via sentimentrader.com.)
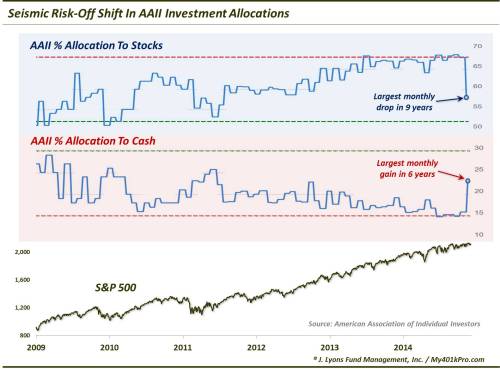
The last time the AAII stock allocation reading fell as much as 10% in a month was in May of 2006. Not even during the 2011 selloff nor the flash crash nor even during the financial crisis did stock investment drop so much in a month. At the same time, the main beneficiary of the decrease in stock allocation was cash. Cash allocation jumped from 15.9% to 22.8% in May, the largest increase since November 2009.
So how should this development be interpreted? Typically, extreme shifts in sentiment are best addressed by fading them – that is, go in the opposite (contrarian) direction, investment-wise. Therefore, the knee-jerk interpretation is that this development is bullish for stocks. There are a couple issues, however, that make us hesitant to lean too heavily on that interpretation.
First off, as the chart indicates, the out-sized drop in stock allocation comes from an extremely high level. We have often seen that one exception to the contrarian behavior in asset prices versus sentiment is when initially reversing from extremes. That is, when sentiment is extremely high, for example, then begins to fall, it is not necessarily a bullish indicator. The reversal from an extremely high sentiment reading can actually mark the beginning of the unwinding of the extreme position. In that case, it can carry potentially intermediate to longer-term negative connotations.
Another asterisk on this development, in our eyes, is the context of the drop in stock allocation vis-a-vis the action in the stock market. During the month of May (which reflects the survey period), the S&P 500 was up just over 1% and closed the month just over 1% from its all-time high. This is not typically the kind of price action that inspires out-sized risk-off type of investment behavior. Participants in this survey, as with most investment surveys normally chase the trend in price. Therefore, this reading seems like a possible outlier, or one-off.
Now, it may be that in this contemporary information age, survey respondents are more aware of their reputation as “fades” or “dumb money”. I think we may be seeing a bit of that in the weekly AAII survey. Participants seem to be reluctant to take either side – bullish or bearish – for fear of being the “mark” and instead seemingly everyone has resided in the friendly confines of “neutral” for several months now.
So back to the dichotomy between the Fed’s household stock investment series and this AAII survey. Which one is correct? Well, for one, thet can both be correct. There is a slight difference in timing that could account for the opposing readings. The Fed series is through March whereas the AAII survey applies to the month of May. So it could be that events since the end of March triggered the change in investment habits that would not yet show up in the Fed data. Again, though, this is unlikely. We spent the better part of the past 3 months writing posts about the historically narrow range in stocks, hardly the kind of action that would inspire a massive shift in households’ investment in stocks.
And therein lies our answer to which data series to lean on more heavily. The AAII allocation survey has been a useful and informative tool. It has generally been more prone to deliberate moves rather than erratic behavior (unlike its weekly sister survey).