

Housing prices are not included in the Consumer Price Index (CPI), a flawed measure of inflation which the Fed uses in setting interest rates. The CPI understates the actual inflation we experience for a variety of reasons which Lee Adler discusses in the following articles.
[Lee Adler's Inflation Headlines Vs. Reality Reveals Outright Government Fraud and This Chart Shows How Badly CPI Understates Inflation are posted below.]
Speak No Evil Financial Media Says No Housing “Inflation”, Only “Growth and Gains”
 Courtesy of Lee Adler of Wall Street Examiner
Recent media reports indicate that house prices are rising so I was curious to see how often today’s news reports on the Case Shiller house price index mentioned “inflation.” I also wanted to see just how bad housing inflation is. Lo and behold, in reading the news reports I learned that there is no inflation in housing!
A CNBC.com post on the Case Shiller used the word “gains” 4 times and “higher” 6 times, but did not mention “inflation.”
Business Insider used “higher” 2 times, and “gains” once. “Inflation?” Zero.
The Wall Street Journal’s piece started with “price growth,” using the “growth” euphemism 10 times, including in the headline. “Increase” showed up 6 times. A total of 16 descriptions of the price change mentioned either growth or increase. “Inflate” or “inflation” how many times? Zero.
Now, Rupert Murdoch owns both the Wall Street Journal and Realtor.com. We shouldn’t expect anything negative from the hired public relations and marketing arm of the NAR.
Bloomberg was more creative with its euphemisms. Its reporters used words like “advance, growth, prop up, gains, healthy, elevated, increased, and climbed.” The words “inflate” or “inflation?” Never.
So, house prices don’t suffer “inflation.” They gain, grow, jump, climb, advance, increase, appreciate, and rise. But they don’t “inflate.”
Meanwhile, house prices do continue to inflate. Only not at the rate that Case Shiller says. Case Shiller uses a 3 month average of sales that CLOSED in August, September, and October. That means its index represents a smoothed average price change on transactions that actually took place 30-60 days before that, or the end of July on average. It’s as if the Wall Street Journal today only reported the Dow as of its 90 day moving average price from late July. Who would care about that?
Isn’t it funny that Rupert Murdoch owns Realtor.com, which has all the data on current contracts as all the Realtors around the country input the current contracts into their MLS databases in real time? Why isn’t The Wall Street Journal reporting the real time sales price data? Is there any other instrument that they report only with a 5 month lag?
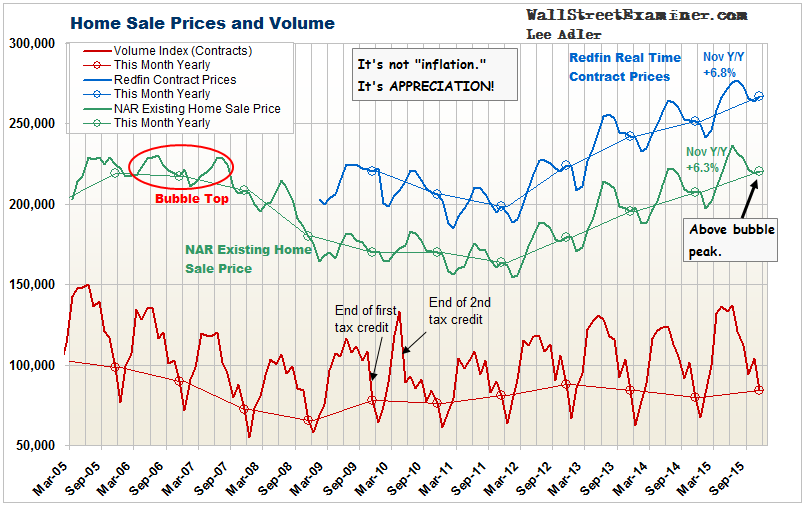
Redfin.com performs a public service by accumulating real time contract prices from MLS’s in 68 of the largest metros in the US. It doesn’t resort to the statistical trickery of moving average smoothing and lagging by 5 months. Nor does it resort to Case Shiller’s repeat sales only trick that tends to suppress the market-wide inflation rate. Redfin’s data on November sales contracts showed a 6.8% housing inflation rate in November. Even the Realtors showed a 6.3% inflation rate on November closed sales. Case Shiller’s number understated the actual current inflation rate by more than 19%.
The real problem will come when prices start to decline. Case Shiller will be at least 5 months late in turning. Robert Shiller was more than a year late in recognizing that prices had bottomed in 2011-12 due to this methodology, which only a Yale economics professor and the Nobel Prize committee could imagine to be relevant. But then the mainstream media treats it as the holy grail, so maybe I’m the crazy one.
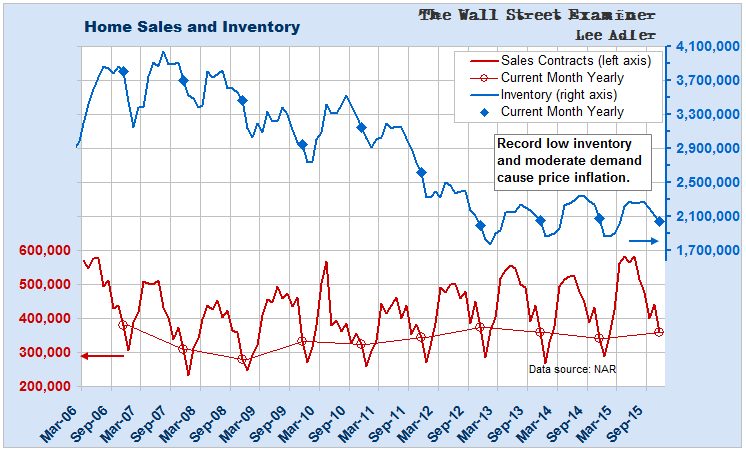
Meanwhile, suppressed inventories and modest demand will continue to stoke housing inflation until more people decide to put their houses on the market.
That might be when interest rates rise enough to entice retirees to sell their houses and put the resulting nest egg into an income producing cash asset. Who knows when that will be? But if and when that happens, any increase in supply would be joined by the demand constraint imposed by rising mortgage rates. The intersection of those two forces would cause prices to begin to decline.
Bob Shiller and the mainstream media will be a couple of years late in recognizing and reporting [a decline in housing prices], thanks to their slavish devotion to an absurdly flawed measure of the US housing market.
****
Read also:
Inflation Headlines Vs. Reality Reveals Outright Government Fraud
By Lee Adler (originally published on Oct. 15, 2015)
The US Government and the Fed measure inflation in a way that is tantamount to reverse Robin Hood theft. Government measures cheat savers and particularly senior citizens while subsidizing the wealthiest big banks and leveraged speculators. They do so by giving the Fed an excuse to perpetuate the ZIRP.
The headlines screeched this morning that consumer prices fell in September. The media dutifully reported that the seasonally adjusted headline number fell 0.2% month to month. The seasonally adjusted core CPI ex food and energy reportedly rose 0.2%.
Nobody in the media questions whether the data accurately represent inflation.
But these numbers do not measure “inflation” accurately. They exclude asset prices and do not properly measure consumer prices. They suppress the reported numbers primarily by vastly understating the rapidly inflating cost of housing, to which the BLS gives the heaviest component weight in CPI.
Seasonal adjustment also suppressed the numbers this month. The basis for using seasonal adjustments on CPI is weak. While prices do not rise on a straight line, there’s little evidence of consistent seasonal variation. On a not seasonally adjusted basis total CPI dipped by -0.15% in September. Core CPI rose by 0.3%.
On an annual basis, headline CPI was down 1.9%, mostly on falling energy prices, which have stabilized this year (gasoline prices up 13% since January). Core CPI was reported to have risen 1.9%. That’s still below the Fed’s 2% target.
Here’s the biggest problem with these numbers: Housing costs account for 37% of headline CPI and 41% of core CPI. The government uses an artificial measure of housing costs called Owner’s Equivalent Rent (OER). It was imputed at a seasonally adjusted rate of 0.3% for September. The annual increase was 3%.
The BLS invented Owner’s Equivalent Rent as a replacement for actual housing prices in 1982 because housing inflation caused the CPI to increase too fast. The government created CPI as a means to index government benefits, salaries, and procurement contracts. The government gets off cheap when it undercounts housing inflation.
The imputation of a false, understated measure for housing costs has saved the government countless billions in the past 33 years and it continues to do so today. For example, in little noticed news today the government announced that Social Security recipients will get no increase in their benefits. What a scam. You can bet a few Congressmen will be hearing from constituents about that.
Actual house price inflation is running at approximately 6% annually. Actual rent increases are running at a rate close to that. According to national housing research firm Axiometrics, annual effective rent inflation was running at +5.3% in September. It was the 8th straight month of increases of 5% or more.
For the government to be imputing rent inflation in CPI at 3% instead of the actual 5.3% is fraud. If housing inflation was included at the correct rate it would add 0.9% to annual core CPI. The correct rate of Core CPI would be +2.8%.
A useful measure for testing this is the BLS’s Producer Price Index for Finished Consumer Goods less Food and Energy. This represents wholesale prices of consumer goods to retailers, which are invariably passed through to the retail consumer. That number was essentially unchanged on a month to month basis in September, slipping by 0.05% (5 hundredths of one percent). It is up by 2.6% year over year.
So while the US Government finds ways to continually punish senior citizens, either by confiscating their savings with ZIRP, or denying them cost of living increases in the Social Security checks by using fraudulent data, in actuality, inflation marches on at somewhere around 2.6% – 2.8% per year.
Meanwhile the Fed remains behind the curve in recognizing that if measured honestly, consumer goods inflation has been above the 2% target rate it announced in 2012 all along. Sadly, the Fed favors a measure called PCE which is even more suppressed than CPI. As long as the government plays with the components of these measures to understate actual consumer price inflation, the Fed will have a convenient excuse to never raise interest rates. The distortions and dislocations caused by ZIRP will continue to fester.
****
This Chart Shows How Badly CPI Understates Inflation
Courtesy of Lee Adler (originally posted on Aug. 19, 2015)
Now that the CPI fiction has been posted, it requires that this post I wrote the other day be recycled for a second reading. The government reported and Big Media press release repeaters dutifully disseminated today that CPI Core rose by 0.1% in July on a seasonally adjusted basis. Below my August 14 report along with the updated chart including July CPI showing just how badly CPI has been understating inflation since 2010.
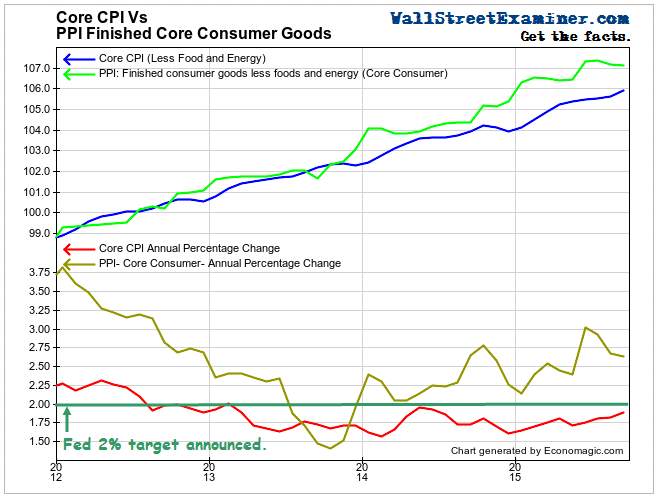
One of the best measures of consumption goods inflation has now been above the Fed’s 2% target for 19 consecutive months.
The BLS Producer Price Index for Finished Consumer Goods Excluding Food and Energy rose at an annual rate of +2.9% in July. The inflation rate of the final cost of consumer goods to retailers has risen faster than the Fed’s target rate of 2% since January 2014 and the rate has generally been accelerating throughout that time. This is a fair gauge of inflation because, unlike the core CPI and the Fed’s favored measure, the Core PCE, this measure isn’t manipulated to exclude or suppress the prices of everything that is rising in price.

Measuring The Inflation Reality Gap
The BLS suppresses its inflation gauges first and foremost by excluding asset prices, where most monetary inflation has been expressed for the past 6 years. Conventional economics theory does not consider rising asset prices to be inflation. Economists call rising asset prices “appreciation” and then conveniently ignore asset inflation and the disastrous consequences of asset inflation. Instead, conventional economics focuses on the inflation of consumption goods, favoring measures that do not accurately measure even consumer price inflation. The CPI was never intended to measure inflation per se. It was intended to index government benefits and therefore is incentivized to keep the number as low as possible.
Everybody is well aware that the BLS uses hedonics–like substituting hamburger for steak when the price of steak rises– to suppress CPI. But the BLS’s biggest suppression technique is to overweight the housing component of CPI, and then refuse to measure it accurately.
Housing accounts for 31% of CPI, but instead of using the input of actual house prices or market rents, the BLS uses a made up number called Owner’s Equivalent Rent (OER), which it plugs in at around the rate of CPI. This perfectly circular logic keeps the CPI trundling along at less than 2%. In actuality house prices are inflating at a national average of around 6%, and market rents are rising 4-5% on average, nationally depending on the gauge, but much faster in many cities.
The BLS did include house prices in CPI until 1982, but it became too expensive, so they removed that component from the measure and substituted OER.
BLS also underweights items like health care and education costs which are inflating far faster than the officials who make the rules for these indices want to see. So those items are suppressed. The Fed’s favored PCE from the BEA uses even more suppression techniques, keeping its rate of increase at well below 1.5% this year.
WIth China devaluing its currency, pundits have concluded that US consumer prices will fall even farther below the Fed’s inflation targets. However, the landed input prices of imported goods are but a fraction of the finished consumer product prices. Transporters, distributors, and retailers add layer after layer of additional costs and margins. My bet would be that the wholesale prices of finished consumer goods won’t come down much, and if they do come down at all, retailers won’t be passing cost cuts along to consumers any time soon. In those rare times when costs fall, retailers typically use that to pad their margins rather than cut prices.
As long as the Fed and its Keynesian economist cheering section choose to only pay attention to inflation gauges that ignore inflation, the Fed might never see its target reached. But the Finished Consumer Goods PPI ex food and energy, a fair measure of consumer prices, has been above the Fed’s target and accelerating since early 2014. The Fed is not only behind the curve, it has driven right through it. Maybe a dim awareness of that deep in the recesses of the central banker mind will keep the Fed on track for an attempt at an interest rate increase this year.
Meanwhile, the question is how long the suppression techniques applied to CPI and PCE will continue to work. Eventually these measures should close at least part of the inflation “reality gap” as the OER factor begins to slowly heat up in delayed recognition of what’s going on in the real world. There was no sign of that in the June CPI. The July CPI will be posted next Wednesday. Won’t it be fun if this is the month when the government fudge numbers finally begin to close the “reality gap.” Just imagine how the markets might react if the headline numbers exceed 2%. Woo.
Picture via Pixabay.