The Problem With Average
Courtesy of Michael Batnick, The Irrelevant Investor
“Statistician, a person who lays with his head in a oven and his feet in a deep freeze stating, On the average, I feel comfortable” ~ Bruce Grossman
Peter Bernstein describes the average and standard deviation of returns perfectly, he said: “The greater the variance or the standard deviation around the average, the less the average return will signify about what the outcome is likely to be.”
With an annual standard deviation of ~20%, stock market investors should probably adjust their 12-month expectations accordingly. Take an investor in 1965 for example, who saw Dow open the year at 875. If they expected to receive average returns over the next 17 years, they would be looking at the Dow finishing 1981 at 2,836. Instead, 1981 closed with the Dow right where it was in 1965, at 875.
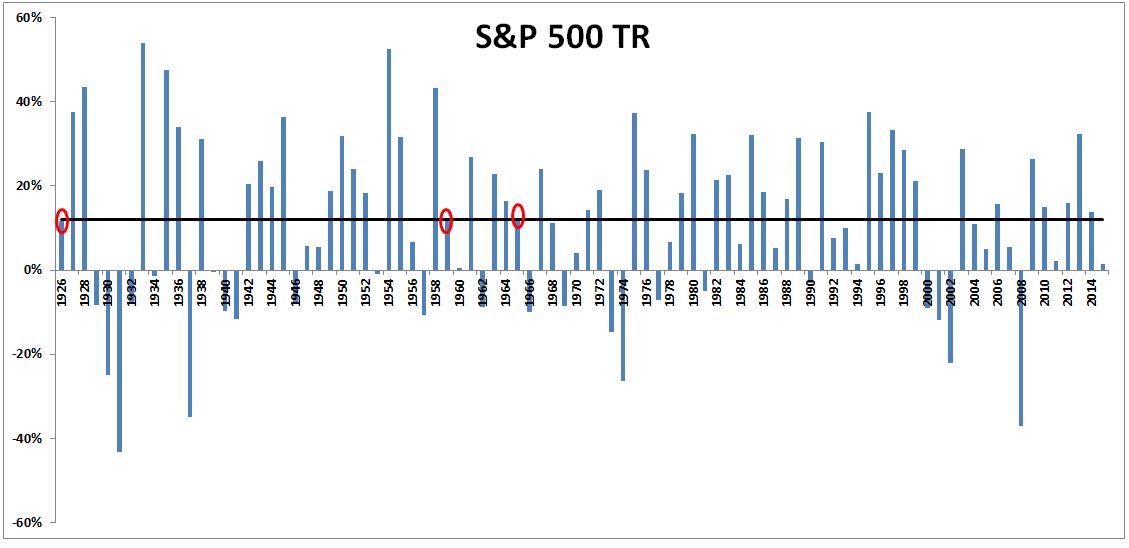
Below are the annual returns for the S&P 500. The red circles represent the years that were within half a percent of the average return. If the average return has occurred in just three out of ninety years, you should probably be very skeptical of anyone crafting a narrative based solely on historical averages.
Below are the average monthly, quarterly, and annual returns of the S&P 500, along with their standard deviation. If stocks truly followed a normal distribution, we would expect that 68.2% of the returns should fall within one standard deviation, 95.4% of returns to fall within two standard deviations, and 99.6% of returns to fall within three standard deviations.
Below are how often the returns actually fall within their respective standard deviations.
Two things stand out to me:
- The range of returns that fall within one standard deviation is pretty large, swinging from 64.4% to 81.1%. This is undoubtedly due to the relatively small sample size; who knows, maybe these will resemble a true bell curve in three hundred years.
- The likelihood of returns being within three standard deviations is very high, but not as high as we might be led to believe. A normal distribution expects just 0.4% of returns to fall in the fat tails, instead real life has shown us that outlier returns have occurred ~1.3% of the time. This might seem like an insignificant number, but it’s these outliers that usually drive a wedge into an investors’ plan
Benoit Mandelbrot described the global economy as “An unfathomably complicated machine. To all the complexity of the physical world of weather, crops, ores, and factories, you add the psychological complexity of men acting on their fleeting expectations of what may or may not happen — sheer phantasms.”
It’s the psychological component in risk assets that sends them swinging well beyond the average, stopping there only for brief periods of time.


