

Courtesy of Lance Roberts of RealInvestmentAdvice.com
Over the past several years, I have repeatedly discussed the ongoing detachment between the economic reports versus what was happening in the actual underlying economy. Last year, I wrote:
“Currently, there is little evidence that is supportive of higher overnight lending rates. In fact, the current environment continues to support the idea of a “liquidity trap” that I began discussing in 2013.
‘…a situation described in Keynesian economics in which injections of cash into the private banking system by a central bank fail to lower interest rates and hence fail to stimulate economic growth. A liquidity trap is caused when people hoard cash because they expect an adverse event such as deflation, insufficient aggregate demand, or war. Signature characteristics of a liquidity trap are short-term interest rates that are near zero and fluctuations in the monetary base that fail to translate into fluctuations in general price levels.'”
The importance of a liquidity trap can not be dismissed as the feedback loop of monetary interventions negatively impact growth by misallocated capital to non-productive uses.
Despite mainstream economists hopes that somehow “this time will be different,” the ongoing massaging of economic data through seasonal adjustments to obtain better headlines did not translate into actual prosperity. Of course, “reality” is a cruel mistress and despite ongoing hopes and overstatements, “fantasy” eventually gives way.
The chart below shows the S&P 500 index with recessions and when the National Bureau of Economic Research dated the start of the recession.
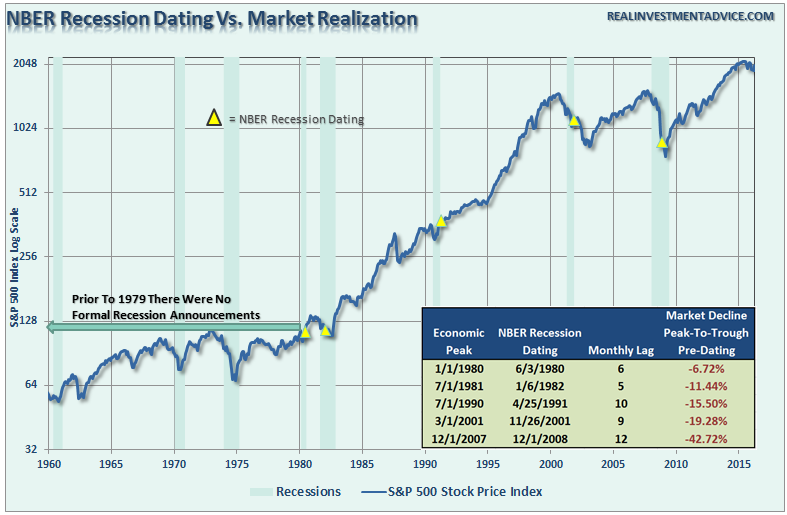
There are three lessons that should be learned from this:
- The economic “number” reported today will not be the same when it is revised in the future.
- The trend and deviation of the data are far more important than the number itself.
- “Record” highs and lows are records for a reason as they denote historical turning points in the data.
Economic Growth Not What It Seems
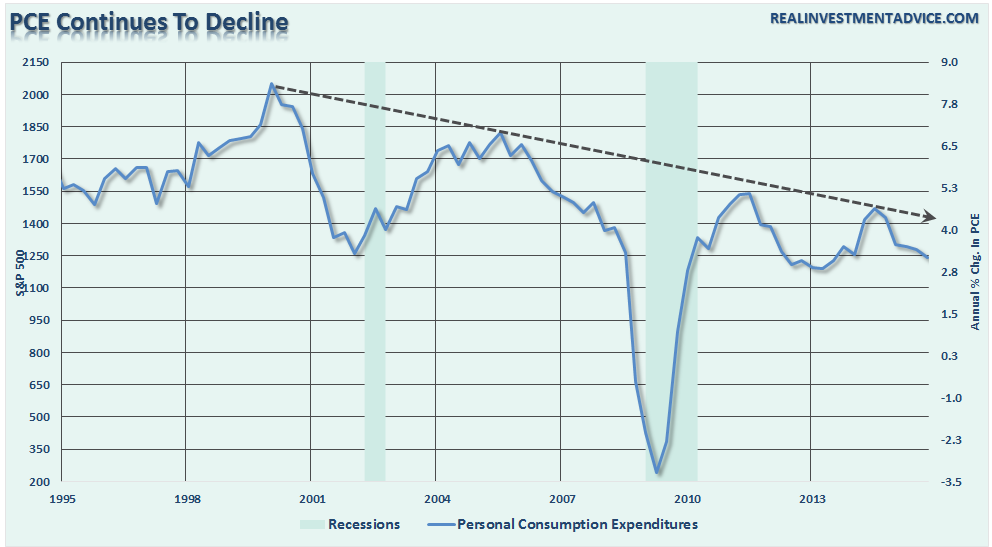
The last two-quarters of economic growth have been less than exciting, to say the least. However, these rather dismal quarters of growth come at a time when oil prices and gasoline prices have plummeted AND amidst one of the warmest winters in 65-plus years.
Why is that important? Because falling oil and gas prices and warm weather are effective “tax credits” to consumers as they spend less on gasoline, heating oil and electricity. Combined, these “savings” account for more than $200 billion in additional spending power for the consumer. So, personal consumption expenditures should be rising, right?
What’s going on here? The chart below shows the relationship between real, inflation-adjusted, PCE, GDP, Wages and Employment. The correlation is no accident.
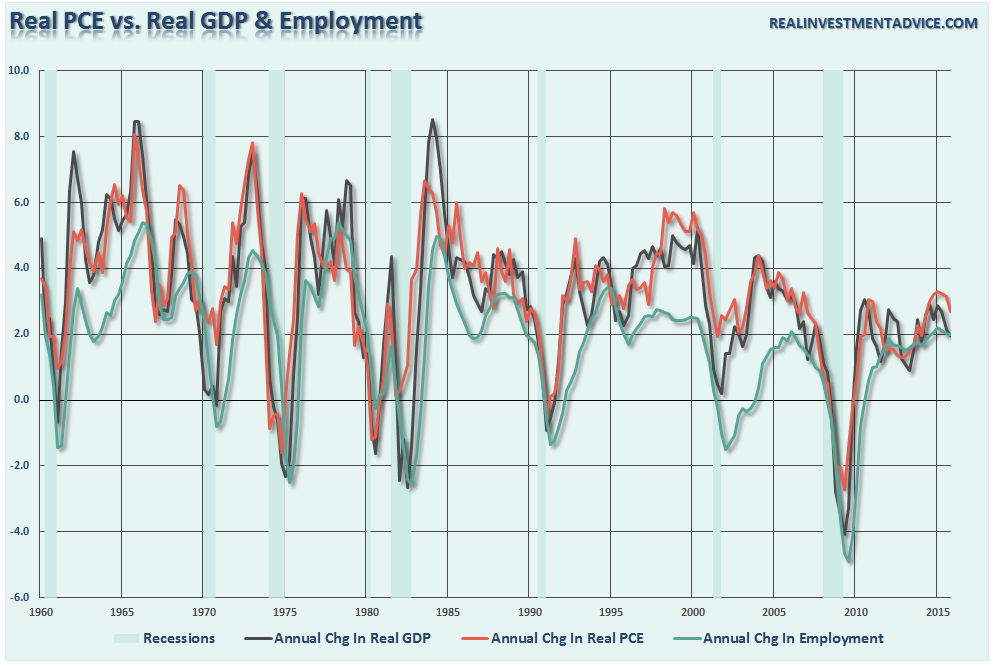
Economic cycles are only sustainable for as long as excesses are being built. The natural law of reversions, while they can be suspended by artificial interventions, can not be repealed.
More importantly, while there is currently “no sign of recession,” what is going on with the main driver of economic growth – the consumer?
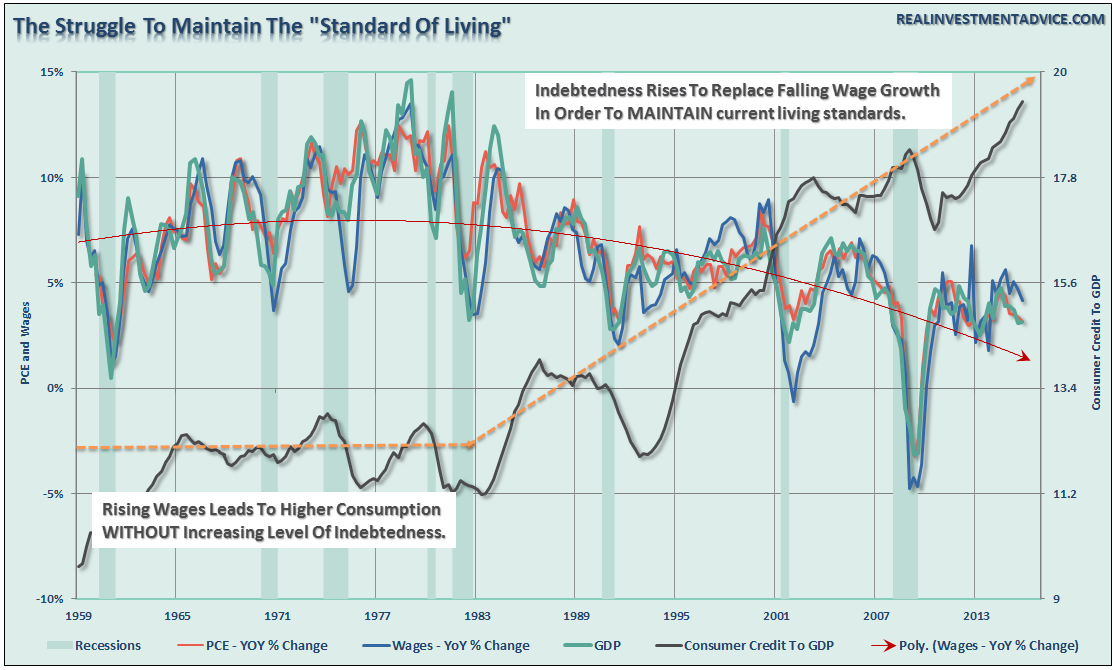
The chart below shows the real problem. Since the financial crisis, the average American has not seen much of a recovery. Wages have remained stagnant, real employment has been subdued and the actual cost of living (when accounting for insurance, college, and taxes) has risen rather sharply. The net effect has been a struggle to maintain the current standard of living which can be seen by the surge in credit as a percentage of the economy.
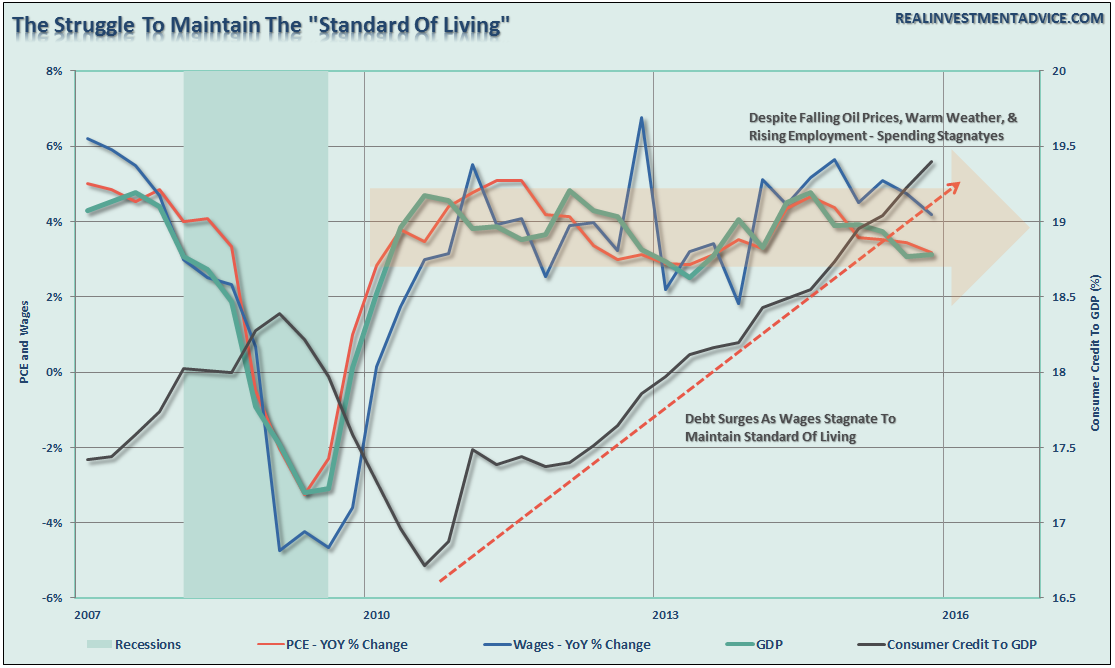
To put this into perspective, we can look back throughout history and see that substantial increases in consumer debt to GDP have occurred coincident with recessionary drags in the economy.
“No sign of recession? Are you sure about that?”
“Despite rumors to the contrary, since 2013, the bond bull market remains alive and “kicking.” This is no surprise as I have written many times in the past, as interest rates, and ultimately bond prices, are a direct reflection of real economic strength and inflationary pressures.”
“Furthermore, the recent decline in rates likely suggests a much weaker economic environment than is currently expected. The last time that rates were this low, and potentially heading lower, was during the economic slowdown in 2012 which bordered on a recession.
In 2012, the Federal Reserve was in extreme accommodation mode, profits were growing and multiples were expanding. That is not the case today.
The takeaway of all this is the risk to equities may be higher than currently expected. If rates, economic data trends, and valuation reversions are sending the correct message, the forthcoming negative revisions to the underlying data will derail the current bullish thesis of a profits recovery in the making.”
I Told You So
So, why all the rehash of commentary from the past three years. Simple. Because, of the following:
“The Department’s Bureau of Economic Statistics (BEA) regularly makes small revisions to its published statistics as more information becomes available over time. But in a massively large adjustment, the BEA just revised downward — by $346 billion — the real (after-inflation) GDP for 50 states and the District of Columbia, covering the 11-year period from 2005 through the end of 2015.
According to BEA’s newest data, real GDP was overstated by about $125 billion from 2007 through 2008, during the period leading into the start of the Great Recession. But the overstatement shrank to about $70 billion in 2009.
During 2012 and 2013, when the U.S. economy had what some have referred to as a micro-recession, the overstatement of real GDP growth ballooned to about $275 billion. Despite over $100 billion in revisions to real GDP growth in 2014 and 2015, the overstatement continued to grow to $324 billion, or 2 percent of GDP.”
This announcement of negative adjustment to GDP is obviously no surprise to regular readers of this newsletter. Since the beginning of this year, I have been hammering on the problem of seasonal adjustments.
“Importantly, the extremely warm winter weather is currently wrecking havoc with the seasonal adjustments being applied to the economic data. This makes every report from employment, retail sales, and manufacturing appear more robust than they would be otherwise. However, as the seasonal trends turn more normal we are likely going to see fairly negative adjustments in future revisions. This is a problem that the mainstream analysis continues to overlook currently, but will be used as an excuse when it reverses.”
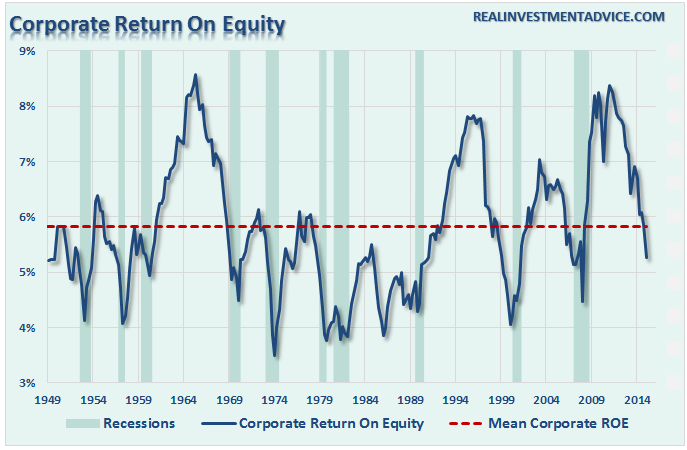
Furthermore, given the weakness in corporate profits and declining return on equity, it is extremely likely the current economic estimates are substantially weaker as well. This suggests that by this time next year, we will once again find out the economy was as weak as corporate profits were already suggesting. Unfortunately, by the time the data is adjusted, and the eventual recession is revealed, it won’t matter as the damage will likely have already been done.
While being optimistic about the economy and the markets currently is far more entertaining than doom and gloom, it is the honest assessment of the data and the underlying trends that is useful in protecting one’s wealth longer term.
Is there a recession currently? No.
Will there be a recession in the not so distant future? Absolutely.
While calls for a “massive recession” may very well turn out not to be true, even a mild recession could have a substantial impact on personal wealth given the current deviation in prices from long-terms norms.
Getting to say “I told you so” isn’t the point of this missive. What is important is understanding that “bullish exuberance” will likely meet its same fatal ending as it always has. Understanding that “risk” is simply a function of how much you will “lose” when you are eventually wrong is the key to surviving the next major market downturn.
“In a bear market, the man who wins is the man who loses the least.” – Dick Russell
THE MONDAY MORNING CALL
The Monday Morning Call – Analysis For Active Traders
Markets Fail At Resistance
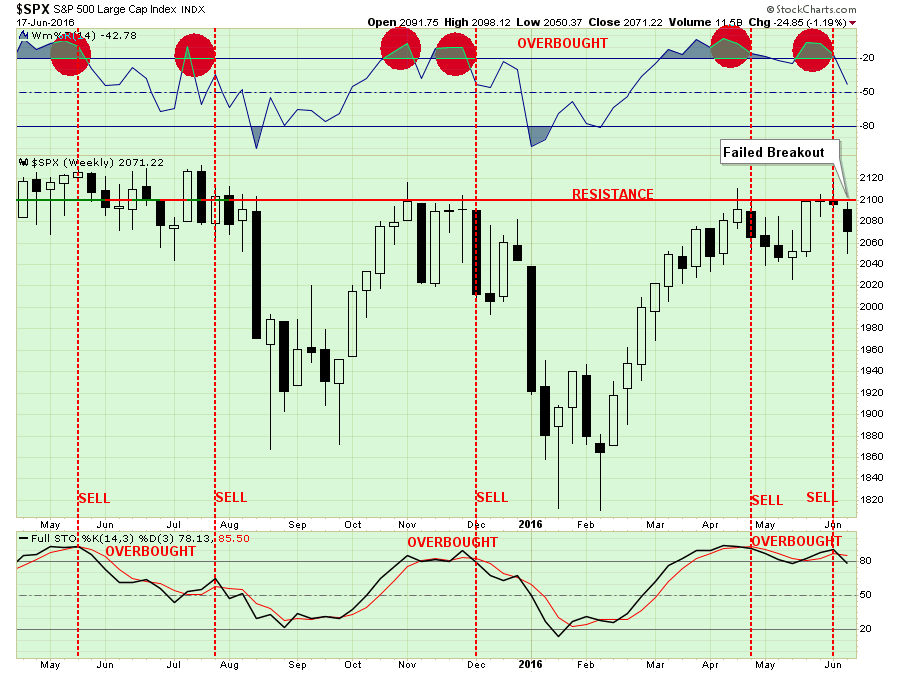
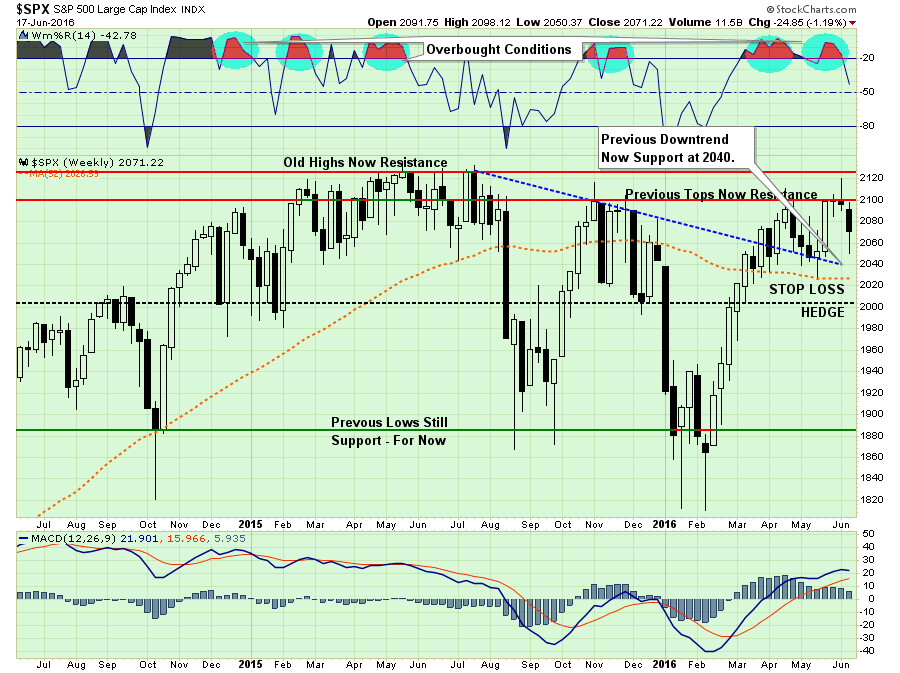
Last week, I discussed the failure of the market to hold its breakout about 2100 which keeps the market confined within the bearish trend that began in May of last year. Here is the updated chart that discussion.
As I stated two weeks ago in this missive:
“With the market now overbought on a WEEKLY basis, there is little “fuel in the tank” to substantially drive prices higher in the short-term.“
In the chart above, I added vertical red dashed lines which denote the combination of both oversold conditions AND a stochastic sell signal. The combination of these two factors suggests more price weakness over the next couple of weeks.
As has been repeatedly been the case, with risk outweighing reward at the moment, a more cautious stance to portfolio management should be considered.
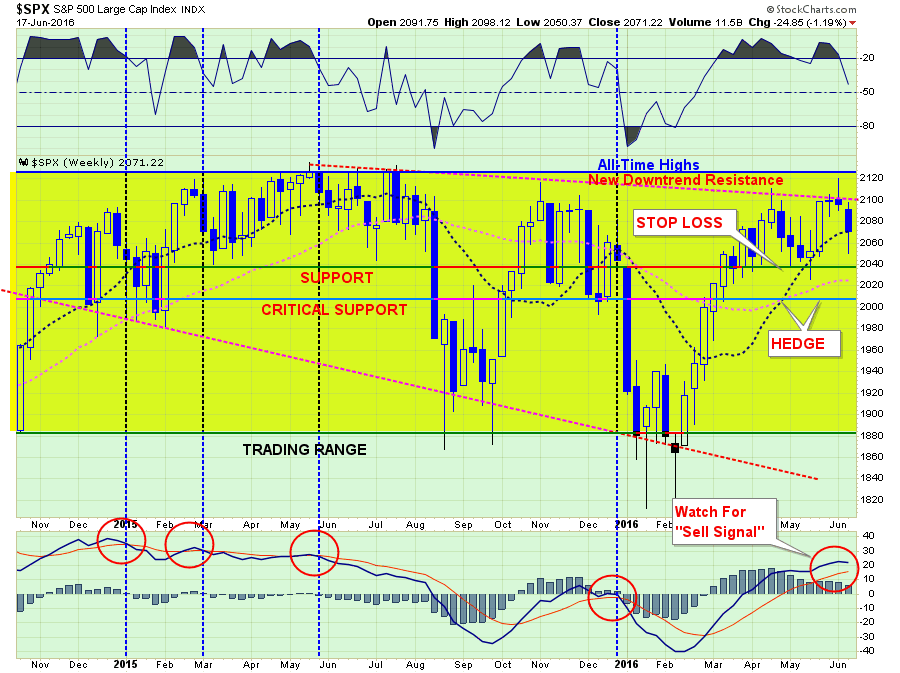
The next chart shows the now 13-month long sideways trading range of the market. However, most importantly, the downward trending price pattern remains in place. The recent failure at the downtrend resistance line remains a concern.
The vertical blue-dashed lines denote market sell signals where subsequent price action has been poor, to say the least. While a “sell signal” is NOT CURRENTLY in place, it will not require much further deterioration in price to trigger one.
As I stated last week:
“As shown in the top part of the chart above, when the markets are as overbought as they are now, it has generally been at, or near, a short-term peak in the market.”
The short-term outlook continues to suggest more vulnerability to selling. The failure of the markets to hold support at 2080 now sets the market up to test support at 2040.
Stop loss levels remain in place at 2040 currently. A break of 2000 will initiate a market-neutral hedging strategy to reduce overall equity exposure and related portfolio risk.
Interest Rates & Bonds
Despite all of the “bullish bantering” by the nattering nabobs who have actually never lived through a bear market, interest rates are currently telling you several things:
- The economy is substantially weaker than headlines suggests (hence the coming negative revisions)
- Money is seeking safety over risk which leaves equity markets at risk of reversions.
- Inflationary pressures are likely lower than advertised, and;
- Recession risks are rising (recessions average 30% bear market declines)
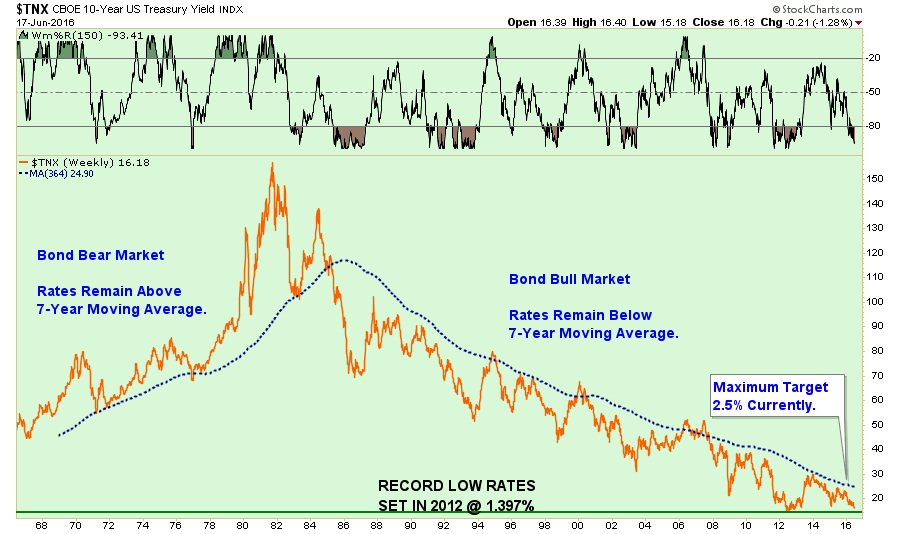
As shown in the chart below, interest rates are now pushing towards their lowest rates on record which were set in 2012 during the “micro-recession” and debt-ceiling default debate.
However, there IS some short-term good news for equity bulls.
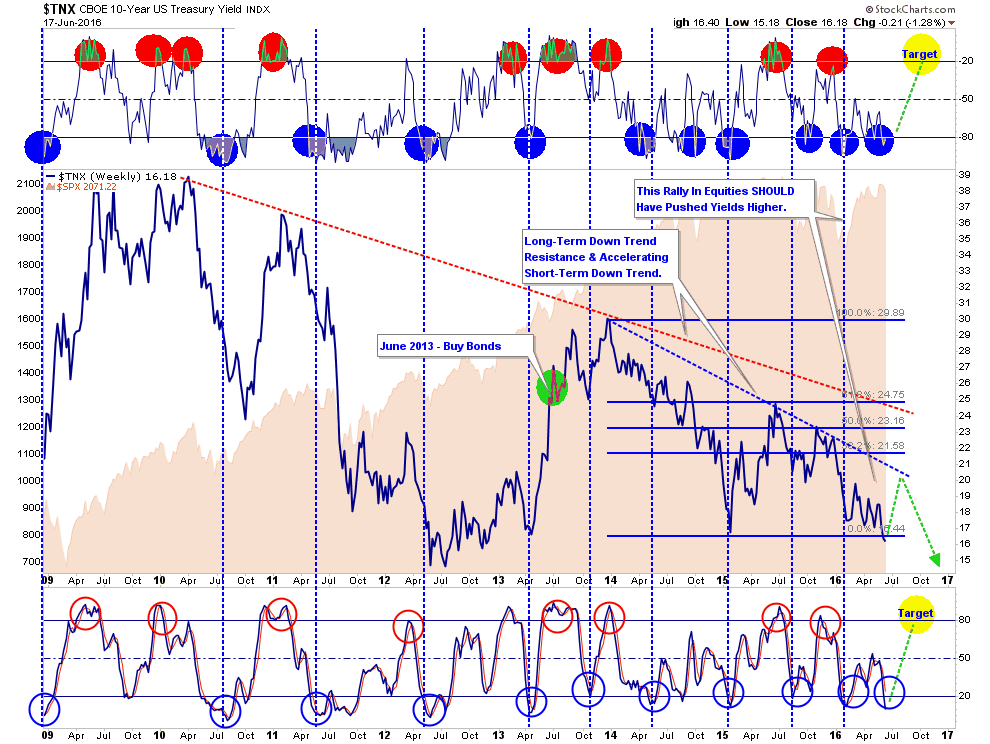
With interest rates extremely oversold, making bonds extremely overbought, a reversal in rates should be expected. Such a reversal should lead, at some point, to a shift back into equities for a counter-trend rally. Unfortunately, as shown above, and below, for those continuing to expect an end to the “bond bull” market, such a counter-trend rally would only likely approach 2%ish.
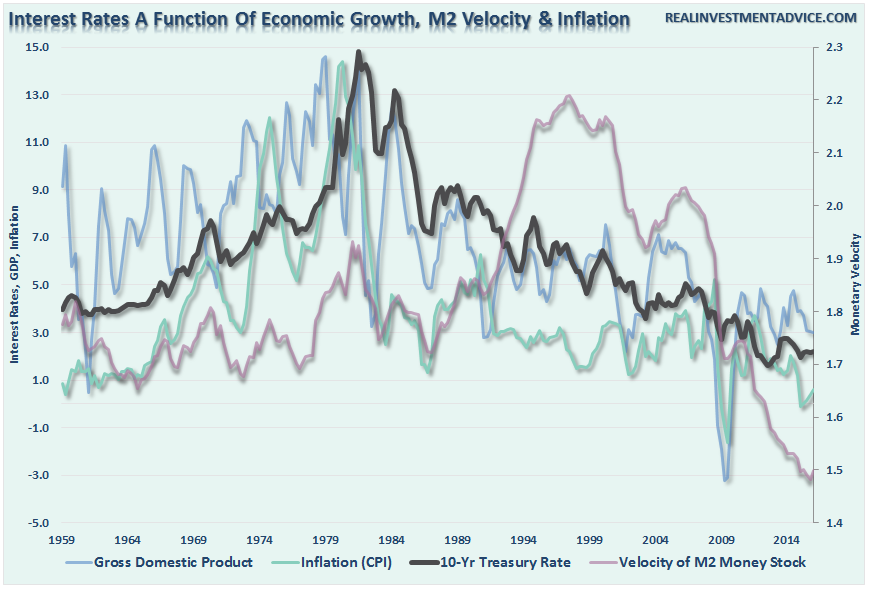
As a quick side note, the death of the “Great Bond Bull Market” is greatly over-exaggerated. As I have written many times in the past, rates are a function of economic growth, inflation, and monetary velocity.
As my friend Charles Hugh-Smith recently penned:
“Take a declining population with declining rates of productivity growth and load it up with debt, and you get a triple-whammy recipe for permanent stagnation.”
While this sounds like what is currently happening in the U.S., he was actually talking about Japan. But the similarities are quite staggering between the two countries, and as with Japan, the ingredients for higher interest rates are simply “gone.”
Furthermore, historically speaking, there is plenty of evidence, much like Japan, we are just beginning an extremely long period of low interest rates. Such will contribute to the expectation of a low-return environment over the next 10-20 years as economic growth remains mired at lower levels.
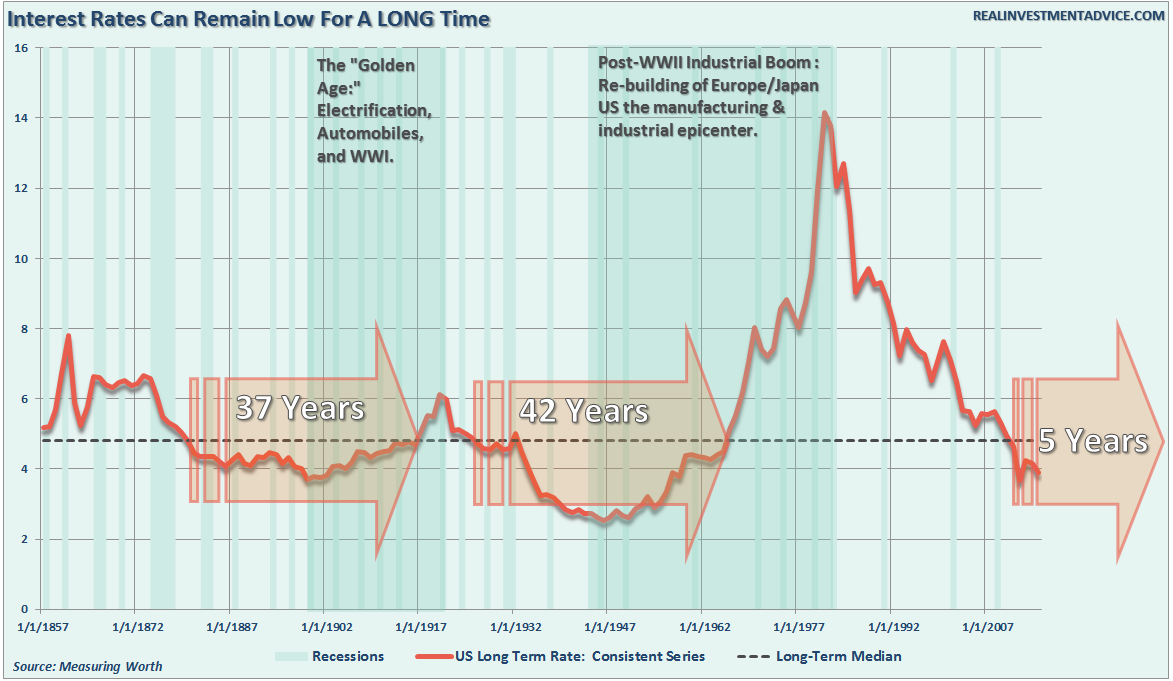
While the “Great Bond Bull” market of the last 30-years, which has been a huge tailwind to overall portfolio returns has been largely harvested, the next 20-years will likely be a trading range that will have to be managed not unlike an equity portfolio.
The new paradigm for adding to portfolio returns will require taking advantage of interest rate declines to shorten-duration and harvest profits, while extending duration and adding to bonds on advances.
Yes, Virginia, you will now have to actively manage risk on BOTH sides of portfolio allocation. However, effectively doing so will set advisors apart from their “buy and hold” counter-parts and create real “value” for their clients.