

Courtesy of Doug Short’s Advisor Perspectives.
Last July, CNN Money featured an article with the optimistic and intriguing title “More American teens are getting jobs. That’s good for everyone.” The article opens with an example of 16-year-old Lauren Miller, who loves her minimum wage job at Hershey Lodge in Pennsylvania, “roasting s’mores and organizing activities for kids.” The article goes on to quote Diane Swonk, chief economist at Mesirow Financial: “The trend is moving in the right direction,” says Swonk. The teenage economy “is certainly something I’m watching more closely” [link].
After reading the article, we revised one of our monthly charts on Labor Force Participation to include the age 16-19 cohort — one we elsewhere combine with the 20-24 year-olds. The first chart below features the three-month moving averages of the non-seasonally adjusted participation rates to better highlight the trends.

Clearly evident in the chart above is the summer skew for both the teenage workforce and, to a lesser extent, the college age 20-24 year olds.
Now let’s take a longer look back at the teenage workforce with a snapshot of the complete data series, which the Department of Labor began tracking in 1948. Note that the seasonally adjusted data smooths out the summer spikes.
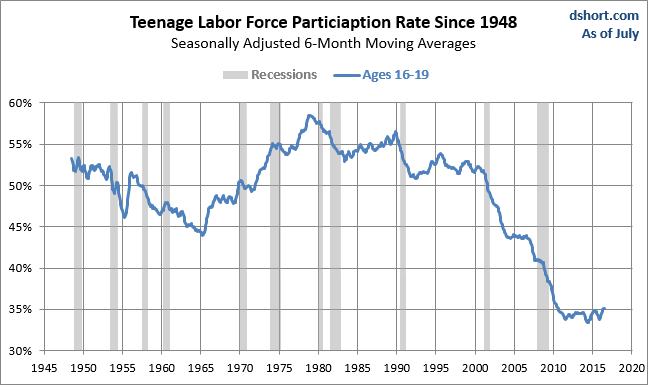
The general trend reversal around 1965 was to some extent a result of the Title VII of the Civil Rights Act of 1964, which prohibits discrimination by race, color, religion, sex, or national origin. Here is the same chart with a gender breakdown.
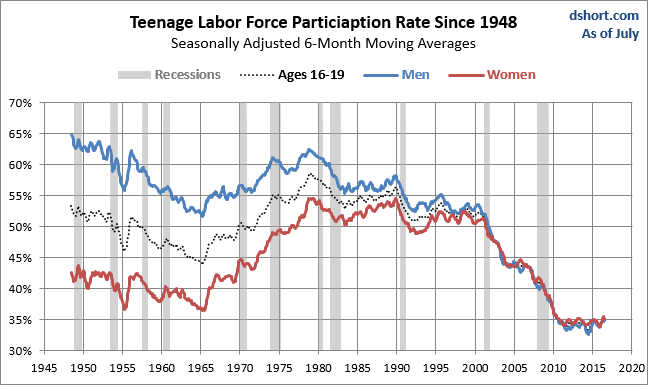
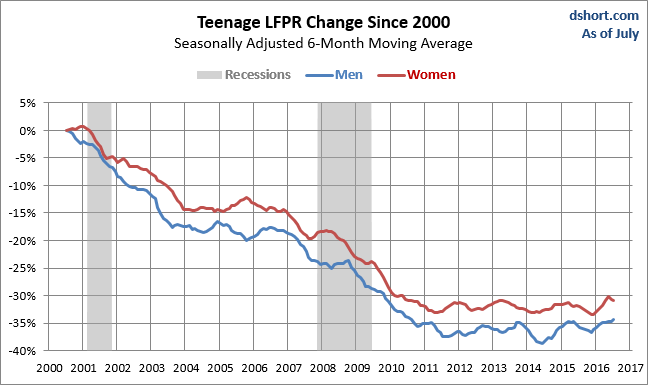
We see in the chart above that its was not until the early years of the 21st century when the gender spread seems to have disappeared. However, when we zoom in on the teen genders since 2000, we see that there remains a small but statically consistent spread. But now it’s the women who have the higher labor force participation. The next chart shows the cumulative percent change of the six-month moving average since June of 2000.
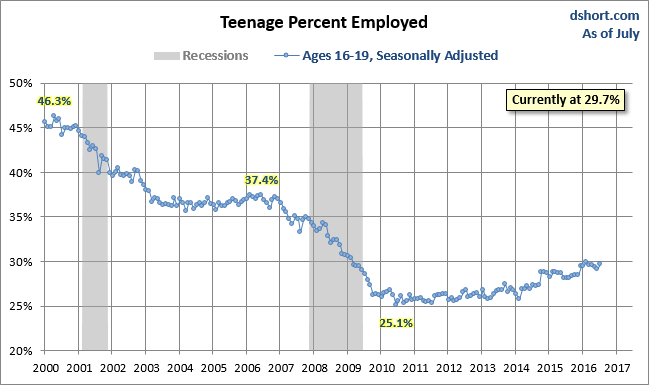
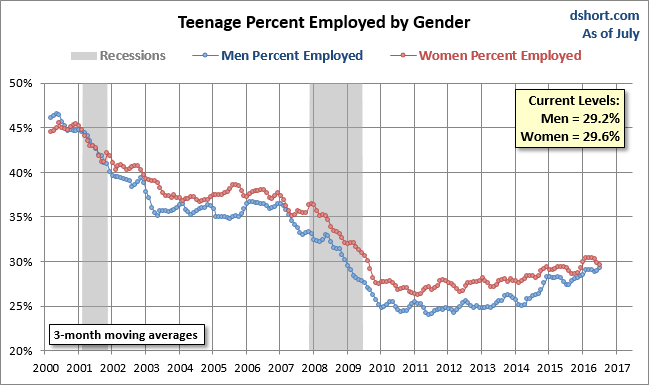
Percent of Teenagers Actually Employed
The labor force statistic we’ve been studying so far is the combined total of the employed and those actively seeking employment. Let’s sharpen our focus to the teenagers actually employed. The next chart divides the seasonally adjusted data for the employed teenagers divided by the civilian noninstitutional population (which is only available in non-seasonal data) for this cohort. In the chart below we see that decline in teen employment during the 2001 recession flattened out briefly in 2002 before declining to a range about 3%-4% lower for the next three years. About a year before the Great Recession, teen employment began another drop-off — one that began to flatten out in early 2010. The trend remained relatively flat with an ever-so-slight drift higher over the past few years.
 The CNN Money article mentioned above features a photo of Wendy Peffercorn, the fictional lifeguard in the 1993 summer classic movie The Sandlot, and the one example of teen employment in the article was a 16-year-old female.
CNN Money‘s spotlight on female teen employment is supported by the fact that women in this age group have had a small but statistically significant higher employment numbers than their male counterparts starting around the end of the 2001 recession. The average of the gender gap since the turn of the century is 1.8%.
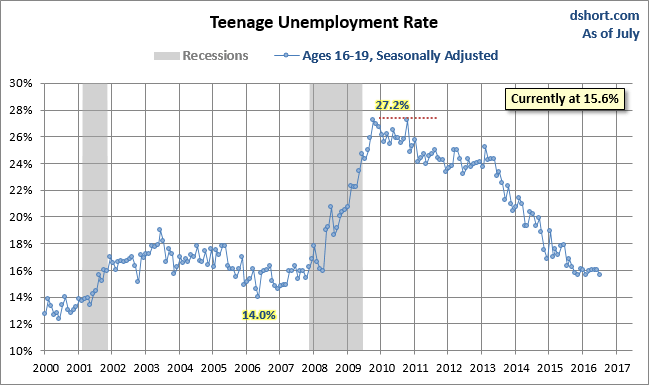
Teen Unemployment Rate
The teen unemployment rate, shown below, gives us a clear sense of how devastating the Great Recession was to this cohort. The high unemployment rate remained fairly stable until early 2013, when we began to see a definite trend lower.
When we look at a gender breakdown, we see that the Great Recession had a greater impact on male teens.
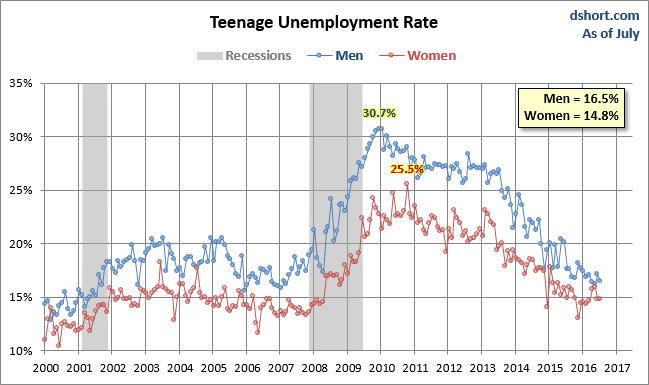
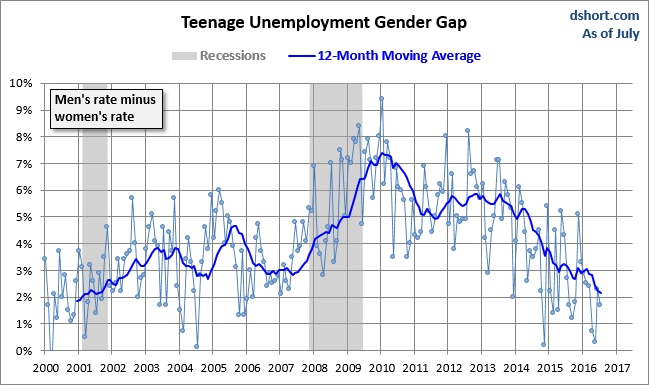
The next snapshot helps us see the magnitude of the unemployment gender gap.
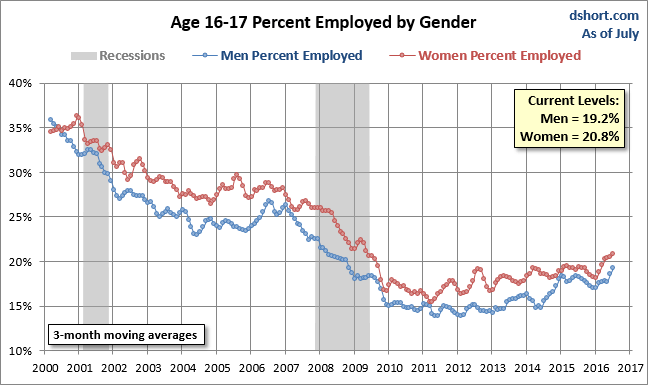
Teens Age 16 and 17
To what extent is the gender gap we’ve been seeing a result of higher non-civilian status for males in the 16-19 cohort? Applicants to enlist in the military must be at least 17 years old. So let’s narrow our focus to the percent employed for age 16 and 17 by gender (yes, 17-year-olds can enlist, but only with parental consent). As we see in the chart below, the gender gap remains. Although it has narrowed in recent months, the average since 2000 has been 2.6%.
In the CNN Money article, Diane Swonk is said to have characterized the trend toward improvement in teen employment as “glacial”. It’s a trend that we’ll continue to watch closely.


