

Courtesy of Lance Roberts of RealInvestmentAdvice.com
Yesterday, media headlines rang out:
“The Markets Just Did Something It Hasn’t Done Since 1999.”
It’s pretty amazing when you think about it for a moment. All three indices hit simultaneous new highs at a time when earnings, profitability, and economic data are deteriorating.
While much of the media analysts continue to suggest there remains a bearish attitude towards stocks, price action of the markets as compared to fundamental data suggests quite the opposite.
The chart below compares the current S&P 500 to both earnings and the annual ROC in GDP.
Notice any similarities?
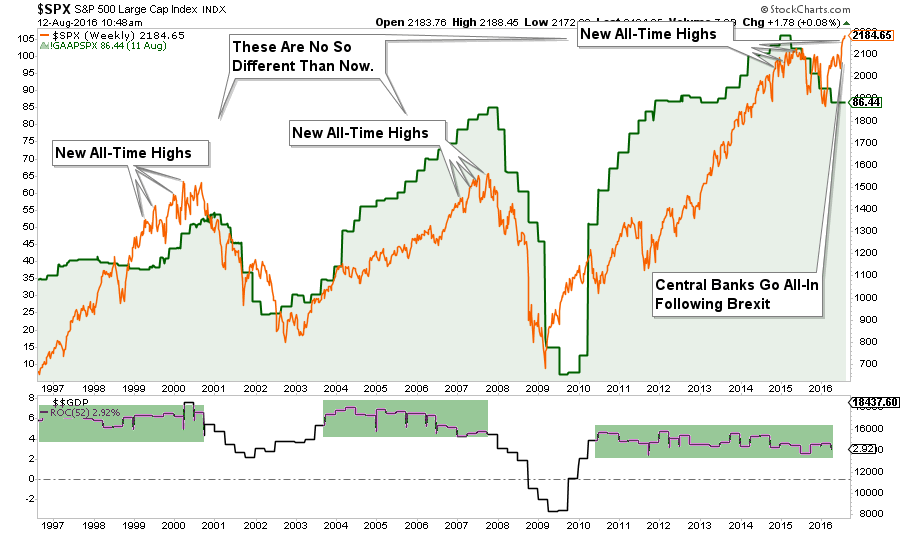
Despite a “belief” that “This Time Is Different (TTID)” due to Central Bank interventions, the reality is that it probably isn’t. The only difference is the interventions have elongated the current cycle, and has created a greater deviation, than what would have normally existed. What is “not different this time” is the eventual reversion of that extreme will likely be just as damaging as every other previous bear market in history.
But, of course, “TTID” is the old Central Bank driven mantra, today it is “There Is No Alternative (TINA).” As stated, regardless of what you call it, the results will eventually be the same.
Chart updated through Friday’s open.
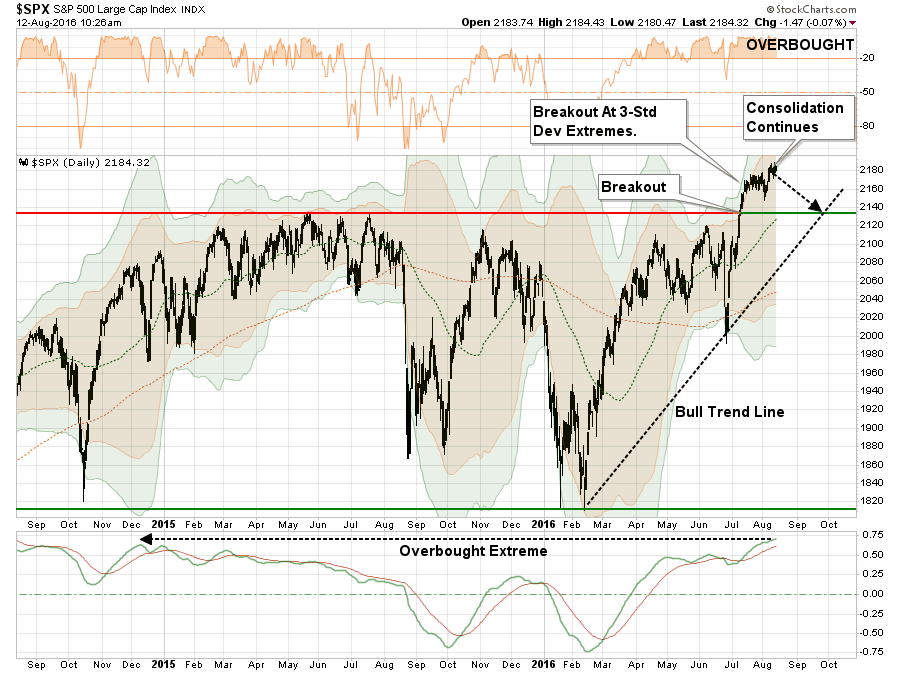
While the market has continued to consolidate gains over the last few weeks, the overbought conditions still remain. As I stated earlier this week:
“The market, on a short-term basis, remains in extreme overbought territory. This needs to be relaxed somewhat before additional equity exposure is added to portfolios. As shown, a reversion to the current bullish trend line, which coincides with the market’s recent breakout levels, is a likely target in the short-term.
However, there is a more than reasonable chance, as I laid out two weeks ago for a deeper correction in the next 60-days. The chart below shows the potential drawdowns from current levels.”
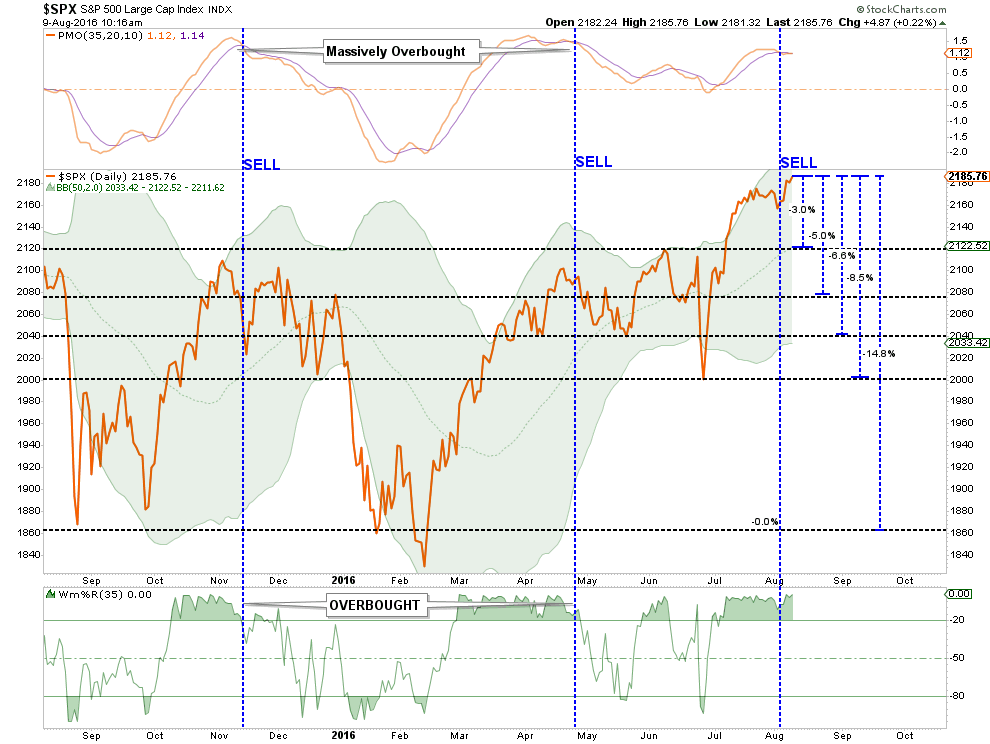
“Here is the point. It would take a correction from current levels to break 2000, which is very important support for the markets currently, to even register a 10% correction.
Given the current bullish exuberance for the market, this is probably unlikely between now and the election. Therefore, even a “worst case” correction currently would likely be an 8.5% drawdown back to major support. Of course, for most individuals, even such a small correction would likely feel far more damaging.“
Let’s take a look at some of the issues that suggest a reversion in prices is likely coming sooner rather than later.
VIX & Junk Bond Spreads Out Of Whack
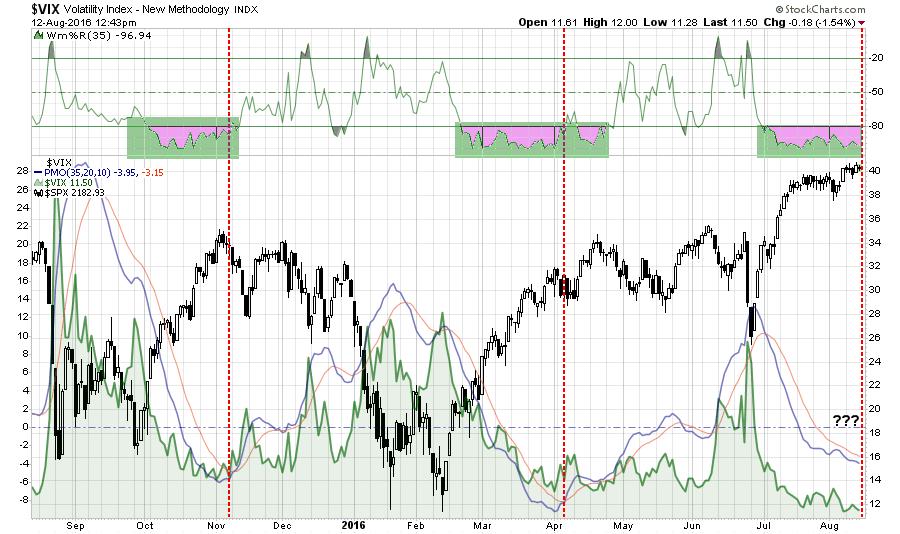
The level of “complacency” in the market has simply gotten to an extreme that rarely last’s long.
The chart below is the comparison of the S&P 500 to the Volatility Index. As you will note, when the momentum of the VIX has reached current levels, the market has generally stalled out, as we are witnessing now, followed by a more corrective action as volatility increases.
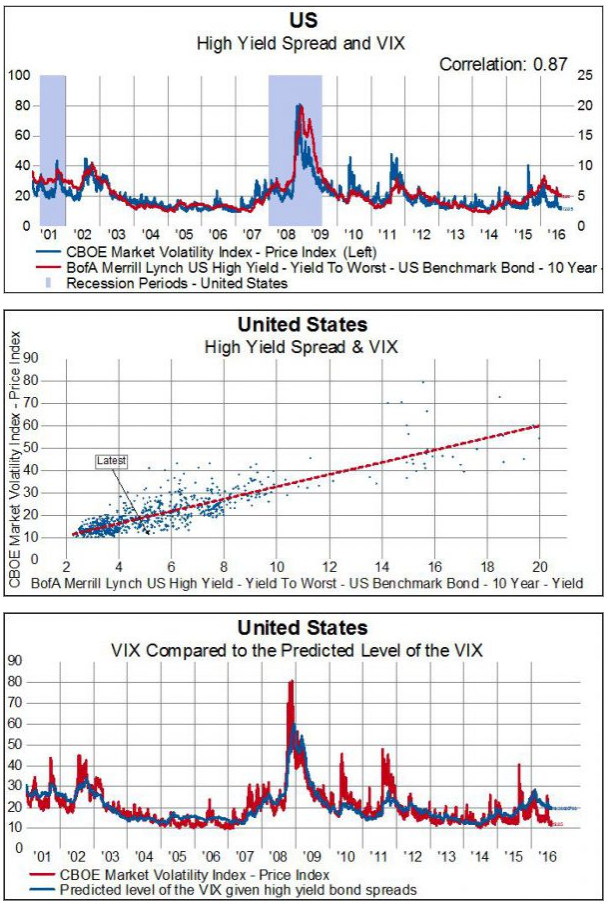
Eric Bush, CFA from GaveKal Research had an excellent piece this week discussing this same idea but also looking at junk bond spreads.
“The relationship between the VIX and the spread between high yield bonds over 10-year treasuries is highly correlated (87% over the past 15 years). This, of course, makes intuitive sense. The VIX tends to spike when confidence in stocks or the economy is shaky. Which is also true for high yield bonds. When investors begin to worry that high yield issuers won’t be able to make debt payments because of, for example, slowing growth, high yield bonds usually sell off against treasury bonds.
This occurred earlier this year in February when the VIX spiked to over 28 and the spreads widened to 850 bps. Since then as investors climb the wall of worry the level of the VIX and high yield spreads have fallen in tandem. However, the level of the VIX has fallen much further and signifies that fears in the equity market are much lower than fears in the bond market. At no point over the past 15 years has this level of the VIX occurred when high yield bond spreads are this elevated. A simple regression model suggests that the VIX should be around 19 rather than the current level of 12. Or looked at from the other angle, high yield spreads are usually 185 bps lower than they currently are when the VIX is at 12. Presumably, this relationship will begin to normalize. The question that needs to be answered is will it normalize because investors ]bid up high yield bonds or because the complacency in the stock market erodes away?”
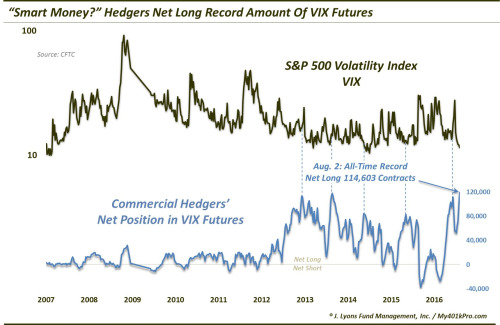
Taking this one step further, Dana Lyons took note of the “Smart Money” hedging against exactly the kind of volatility increase I am discussing. To wit:
“As we have discussed on many occasion, these hedgers are often considered ‘smart money’. This is a bit of a misnomer which causes some confusion every time we use the term. It is not that these hedgers (e.g., banks and large financial institutions) are always right. In fact, they can be wrong for long stretches at a time in a strong trending market. However, we know what typically occurs when the speculators’ positioning becomes too one-sided or extreme – the market reverses on them. And as they are on the other side of the position, these commercial hedgers are typically correctly positioned at major market turns. Thus, the ‘smart money’ moniker.
This is relevant now due to the aforementioned speculator position. As such, commercial hedgers currently own their largest net long position in the 10-year history of the VIX futures contract.”
As always, timing is everything.
The point here is simply the “risk to reward” dynamic for either adding to current long-positions or maintaining overweight equity positions in portfolios will not likely pay well.
As I have noted repeatedly in the past, maintaining your portfolio through a disciplined investment process will reduce risk and increase long-term profitability.
- Tighten up stop-loss levels to current support levels for each position.
- Hedge portfolios against major market declines.
- Take profits in positions that have been big winners
- Sell laggards and losers
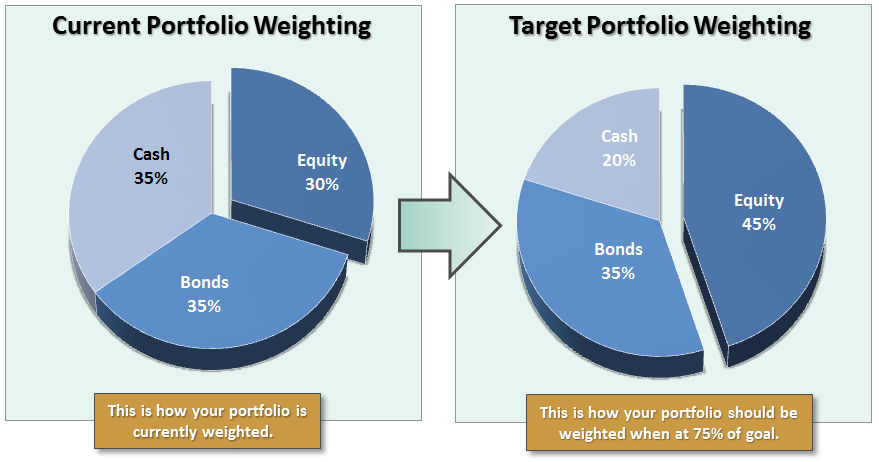
- Raise cash and rebalance portfolios to target weightings.
Still Waiting On A Correction – AGAIN
From last week:
“So, am I buying equities to move portfolios to the current target allocation?
Not yet.”
I know. Boring.
It has now been FIVE weeks since the market broke out of its 18-month consolidation process at which time I laid out the case to increase equity exposure in portfolios. I have been repeating that case here each week, primarily for new readers, with not opportunity to adjust exposures as of yet.
“But Lance, you just laid out a very bearish case for stocks. Why are you talking about increasing exposure?”
That is a fair question.
Managing money is about managing the risk of loss. Notice that I did not say “creating returns.”
If I manage portfolios against the potential of long-term impairment of capital, the creation of returns becomes a byproduct of that effort.
Currently, while there is a very bearish case to be made from the deterioration of economic and fundamental variables relative to the market, the current technical price dynamics are both bullish and positively trending. Therefore, as a money manager, I want to maintain exposure to the equity markets until such time as the technical price dynamics change from bullish to bearish.
I have stated repeatedly over the last couple of weeks that the breakout of the market above the 18-month consolidation range was bullish and demands an increase in equity exposure. However, such an increase must be done when the risk-to-reward ratio is favorable which is what I am currently patiently waiting for. I have laid out the potential price corrections needed to both warrant, and negate, such an equity exposure increase.

As Doug Kass noted this past week, there is a trio of factors pushing stocks higher.
- “Central-bank policies are succeeding in encouraging risk takers to take more risks in long-duration financial assets, while central-bank purchases have sent financial-asset prices spiraling upward and reduced volatility (as measured by the VIX). This has created what I call the Bull Market in Complacency — an almost universal view that any drawdown in market prices will be limited.
- Many U.S. corporations that face lackluster top-line growth are repurchasing stock in record amounts at record prices rather than doing capital spending to bolster their physical plant. This boosts stock prices, satisfying large shareholders and feathering insiders’ portfolios.
- While many retail investors are long gone from the stock market, volatility-trending strategies, risk-parity trading systems and other quant programs keep pushing stock prices to new all-time highs.
All this feeds on itself, but what’s surprising is that few question how the above factors contribute to higher asset prices. They fail to recognize that if there were no adverse consequences low or negative interest rates, massive liquidity injections and central banks buying stocks, these would have become permanent and continuous monetary-policy strategies decades ago.
Bingo.
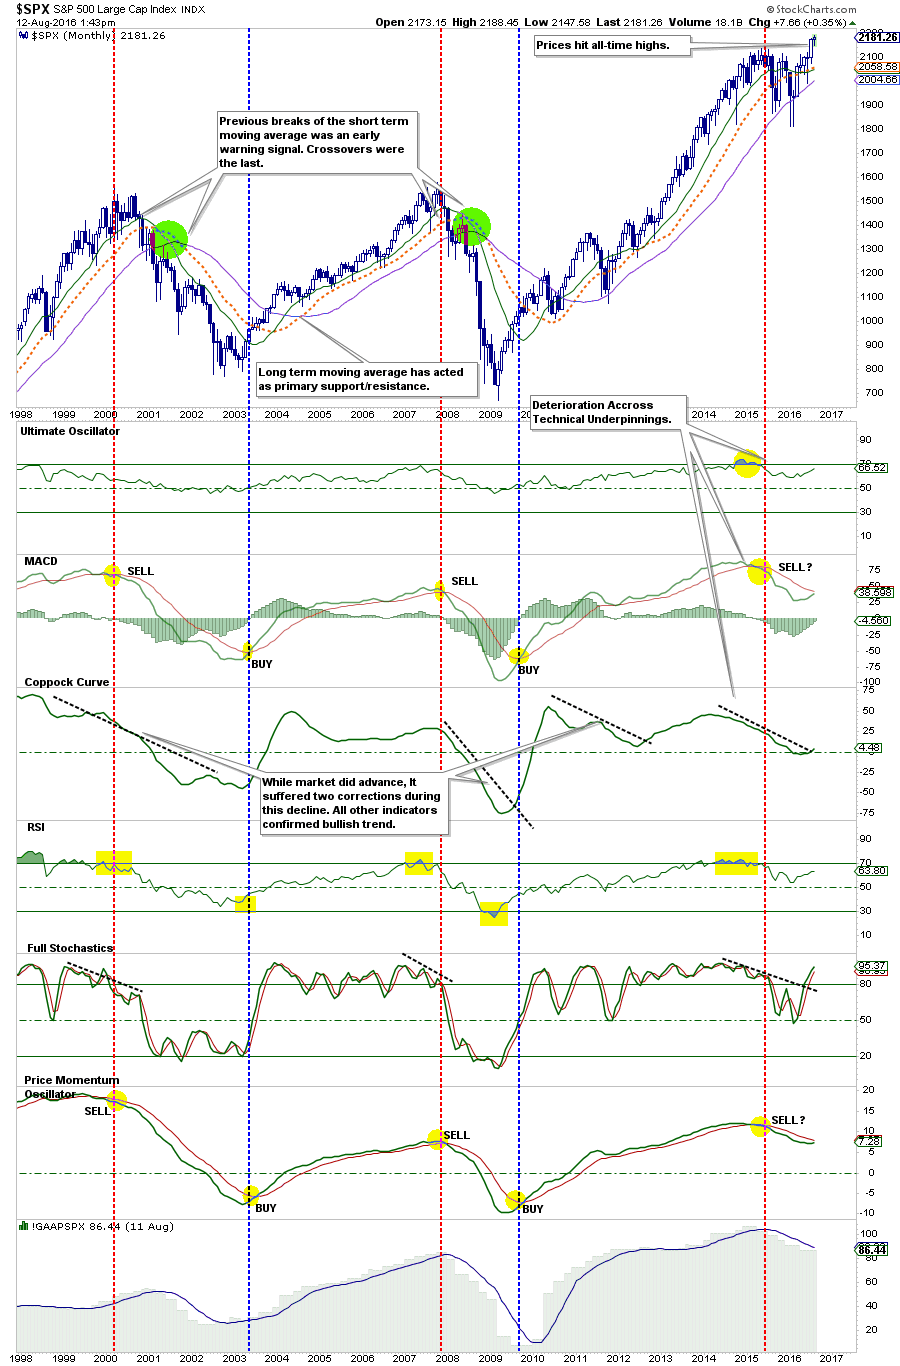
The “big chart” of technical underpinnings clearly suggest that while prices are bullish, the underlying “health” of the market remains weak.
What Can Go Wrong? A Lot!
Unfortunately, several factors could cause an unceremonious change in the market’s direction at any moment. As Doug notes:
- “An Abrupt Growth Slowdown. Low U.S. interest rates have pulled forward demand, and from my perch, we’re already seeing ‘Peak Autos’ and ‘Peak Housing.’ I wonder whether U.S. consumer spending’s recent strength is sustainable … or just the last gasp of growth?
- A Possible Deeper ‘Earnings Recession.’ Will corporate profit margins get squeezed even further going forward?
- An Abrupt Reversal for Stocks. This could ‘just happen’ out of the blue, or it could stem from an exogenous political or geopolitical shock. Or it could follow something else that investors aren’t even thinking about. My concern is that an abrupt change in sentiment or stock prices could ignite a selling stampede from the influential quant community, just as ‘portfolio insurance’ precipitated the October 1987 Wall Street crash.
- A Quick Climb in Interest Rates. This could, among other things, curtail mergers and acquisitions and/or stock-repurchase programs.
- An Abrupt Rise in Inflation or Inflationary Expectations. This could spark higher interest rates.
- A Federal Reserve Policy Mistake. We can never rule this out.
- A European Banking Crisis. This could have a “contagion effect” around the world.
- Policies that Destabilize Currencies. Again, this is always a possibility.
- A Zika Virus Outbreak or Other Health Event. Few investors are even thinking about this.
- A Monumental Hacking. A major computer hack of the U.S. banking and investing complex could disrupt everything.
- Something Else. We face all sorts of other risks that no one is even considering.”
The Bottom Line
I agree with Doug. The view of “TTID” or “TINA” will likely end very badly for investors over the longer-term time frame. Distortions of price from reality are short-term, emotionally driven, cycles.
With the S&P 500 trading at more than 25x GAAP earnings, 18x non-GAAP profits (one of the largest differentials between GAAP and non-GAAP in history), risk vs. reward is simply not present in the long-term.
However, in the short-term, we must recognize the potential for the markets to remain “irrational” longer than logic would currently dictate. This is why I am cautiously managing portfolio risk and allowing the markets to “tell me” what to do rather than guessing at it.
What happens over the next few days to weeks is really anyone’s guess. The data continues to suggest some sort of corrective action over the next two months (as discussed previously) which will provide a better risk/reward setup for increasing equity exposure in the short-term.
But, over the longer-term time horizon, I am unashamedly bearish as the current detachment between prices and fundamental reality can not last forever.
Eventually, something’s gotta give.
“A bull market lasts until it is over.” – Jim Dines