

By David Trainer. Originally published at ValueWalk.
Dan O’Connor, TechCXO Partner – Guest Contributor
David Trainer, CEO New Constructs
This article originally published here on January 30, 2017.
Executive Summary
A company’s market capitalization and enterprise value are linked together to provide alternative value measures for different stakeholders. Market capitalization reflects the value of a company from the common shareholder perspective that is translated into a share price. Enterprise value represents the sum of claims by all company stakeholders: creditors (secured and unsecured) and shareholders (preferred and common). Since US stock indexes reached all-time highs during November 2016, we were interested in analyzing the components of enterprise value to ascertain the proportion of enterprise value that is attributable to existing operations, versus expectations on a company’s ability to generate economic profits (as opposed to accounting profits) in the future.
We conducted an analysis, as of November 30, 2016, of companies included in the S&P 500 and the Russell 3000 to reverse engineer the components that make up each company’s total enterprise value. Leveraging data and analytics provided by New Constructs, we calculated for each company included in the Indexes how much of their total enterprise value was attributable to the current value of their operations and non-operating assets vs. the future value of their growth options. Previously, conducting such an analysis of both indexes simultaneously was infeasible due to technology limitations and scalability challenges. We were expecting to see the majority of enterprise value linked to companies’ future value of growth options. This is not what the analysis showed. From this analysis, there were several interesting insights, including:
- Invested Capital Represents the Largest Component of Enterprise Value
- Companies Struggle to Generate a Return on Invested Capital (ROIC) Greater than their Weighted Average Cost of Capital (WACC)
- ROIC Across Sectors Varies Significantly
- Future Value of Growth Options (FVGO) as a % of Enterprise Value was Lower than Anticipated
You create value for your company by investing capital to generate future cash flows at rates of return that exceed your cost of capital. Unless your company’s return on capital (ROIC) exceeds your cost of capita (WACC), no amount of revenue growth can create value. These principles apply equally to public companies as well as to privately-held enterprises.
For the Russell 3000, we identified 1,312 companies that have a Present Value of Economic Profit (Loss) in perpetuity totaling a negative $6.0 Trillion. If these 1,312 companies could earn a ROIC just equal to their WACC, shareholder value / enterprise value would increase by $6.0 Trillion, all other things being equal. We also identified 216 companies in the Russell 3000 that have a “negative” future value of growth options (FVGO) totaling $1.0 Trillion. If these 216 companies could reduce their “negative” FVGO to just zero, shareholder value / enterprise value would increase by $1.0 Trillion. Comparable results were obtained from our analysis of the S&P 500 Index companies.
The potential opportunity to unlock value for companies in the Russell 3000 can be even greater than the $7.0 Trillion detailed above. Think of the $7.0 Trillion as just getting back to “break-even” from an enterprise value perspective. If these companies identified above could start to earn a positive spread on ROIC vs. WACC, and convince the Capital Markets that they will create, rather than destroy, shareholder value in the future, this $7.0 Trillion opportunity could increase significantly.
We conclude this article by introducing a new paradigm for optimizing all the sources of capital of a company – monetary, physical, relational, organizational, and human capital that can be utilized by public companies as well as privately-held enterprises. This new framework can be deployed by executives at all levels throughout their organizations – Enterprise Level, Business Unit / Subsidiary level, and Individual Project Level. Strategic initiatives can be linked to their potential impact on enterprise value and share price in a transparent manner, providing “one version of the truth” that can be shared with all company stakeholders. Technology breakthroughs made by New Constructs and TechCXO allow enterprises of all size to close potential valuation gaps between their market value and intrinsic value. It is now possible to reverse engineer every part of your company’s enterprise value to isolate potential drags on your current share price and act proactively to:
- Avoid Valuation Traps
- Optimize all Components of Enterprise Value
- Improve ROIC
- Manage Innovation Initiatives as a Portfolio of Growth Options
- Align Stakeholder Expectations
The Analysis
We conducted an analysis, as of November 30, 2016, of companies included in the S&P 500 and the Russell 3000 to reverse engineer the components that make up each company’s total enterprise value.
For purposes of this analysis, enterprise value is calculated in two ways:
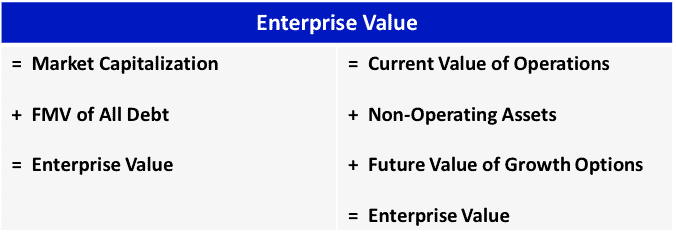
Enterprise Value Components
Enterprise Value is a proxy for the takeover value of a company and can be difficult to calculate due to various accounting distortions, such as inventory reserves, asset write-downs, and off-balance sheet operating leases. Thus, the components of a company’s enterprise value cannot be easily extrapolated from their GAAP-based financials. For example:
- Non-Operating Assets include items such as excess cash, assets from discontinued operations, and unconsolidated subsidiary assets.
- Included in the FMV of All Debt are Executive Stock Options (after-tax), minority interests, and underfunded pension plans.
- Current Value of Operations is calculated as the sum of the company’s Invested Capital plus the Present Value of Economic Profit (Loss) in Perpetuity. Economic Profit differs significantly from GAAP-based net income as accounting distortions are removed, and a charge for the use of all capital is deducted in computing Economic Profit (Loss).
- The Future Value of Growth Options (FVGO) represents the Capital Markets’ assessment of a company’s growth initiatives. In other words, FVGO represents investors’ evaluation of the company’s “path-to-growth strategies” and their ability to create shareholder value in the future.
In summary, enterprise value can be viewed simply as the value of the company’s “Assets in Place” (Current Value of Operations Plus Non-Operating Assets) plus the value of “Assets to be Acquired in the Future” (FVGO).
New Constructs Analytics
Leveraging data and analytics provided by New Constructs, we calculated for each company included in the S&P 500 and Russell 3000 Indexes how much of their total enterprise value was attributable to the current value of their operations and non-operating assets vs. the future value of their growth options. Previously, conducting such an analysis of both indexes simultaneously was infeasible due to technology limitations and scalability challenges. New Constructs has solved the technology challenge by automating the data gathering from SEC filings (including accompanying footnotes) that are required for the proper analysis of each company’s enterprise value. Accounting distortions (30+ potential adjustments) are removed for each company, providing a standardized, “one version of the truth” to benchmark each company against peer groups and across industry sectors. New Constructs updates it data base daily, so enterprise value metrics are available in real time.
Summarized in the tables below are the enterprise value components (as of November 30, 2016,) for companies included in the S&P 500 and the Russell 3000 by sector:
Table 1: S&P 500 (Figures in Millions of USD)

Sources: TechCXO, New Constructs, LLC, and company filings
Table 2: Russell 3000 (Figures in Millions of USD)

The post The $7.0 Trillion Opportunity In the Russell 3000 appeared first on ValueWalk.
Sign up for ValueWalk’s free newsletter here.


