

Courtesy of Phil Stasukaitis (pstas)
I was asked by my local investment club to do a presentation on "how to buy a stock?" As I pondered the question, I began by noting all the elements that I monitor regularly and which come in to play as part of my decision process. As the group is comprised novices to experts, I tried to gear my discussion to cover both basics and more advanced concepts.
 Four Part Discussion
- Macro Economic Indicators
- Market Indexes
- Fundamental Analysis
- Technical Analysis
1. Macro Economic Indicators
We'll start with reviewing some basic concepts and measurements that have direct effects on the stock market.
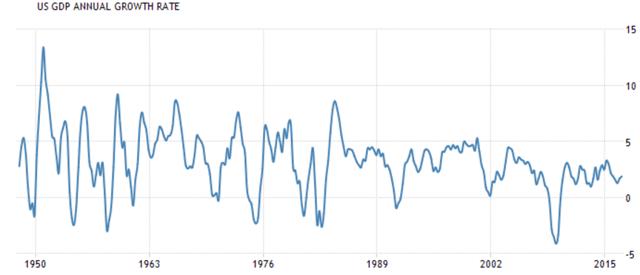
A. Gross Domestic Product (GDP)
Data source: Dept. of Commerce/Bureau of Economic Research (https://www.bea.gov/index.htm)
Total market value of US produced goods and services – $18 Trillion.
GDP measures total US economic activity. Positive numbers indicate expansion; negative numbers indicate contraction, i.e., recession. In the past, there usually have been accelerated expansions coming out of recessions. That has not been the case since the Great Recession. 2% annual GDP growth, plus or minus, appears to be the new normal.
The GDP and change in GDP are "lagging" indicators meaning they tells us where we have been. Where the economy is headed falls to GDP forecasts which are regularly issued from various sources.
B. Consumer Price Index (CPI)
The CPI is used to measure inflation. The CPI measures changes in the prices paid by urban consumers for representative basket of goods and services. Latest report on the last 12 months gave a CPI reading of +2.5%. The Federal Reserve uses a different inflation measure, Personal Consumption Expenditures (PCE). CPI is based on a survey of what households are buying; PCE is based on surveys of what businesses are selling. Both measures break out "headline" and "core" numbers. Core numbers strip out housing and energy which tend to be more volatile month to month.
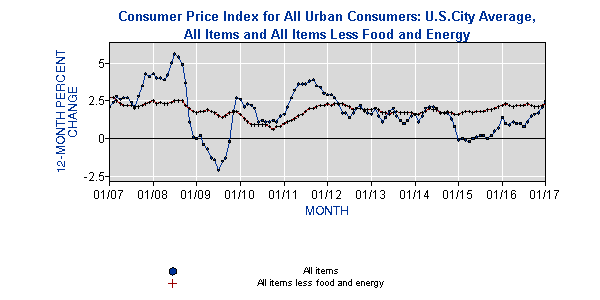
Source: Bureau of Labor Statistics- US Dept. of Labor https://www.bls.gov/
C. 10-Year Treasury Note
The Ten Year Treasury is often used as a benchmark for measurement of individual stock and/or portfolio performance. A commonly used comparison is the S&P earnings yield relative to the 10-Year Treasury Note. The S&P forward earnings yield is calculated by taking the forward earnings estimate (now about $130 for the next 12 months) divided by the SPX index close (2,328 as of Thursday, April 15) for an "earnings yield" of 5.5%. The difference between the 10-Year and the S&P earnings yield is considered the "risk premium" an investor obtains by investing in stocks versus bonds.
Note: bonds are interest rate sensitive. Bond prices decrease as interest rates increase and bond prices increase as interest rates decrease. Generally, a bullish outlook for the economy and/or higher inflation expectations often can result in higher bond yields, thus lower bond prices.
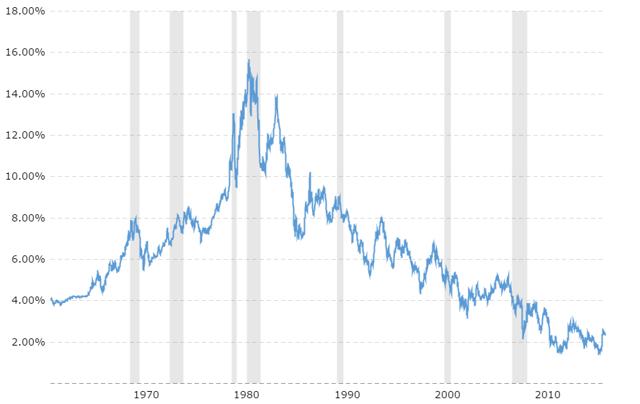
Interest on 10-Year Treasury Notes over time
Bonds/Treasury Notes have various maturity dates ranging from a few years to 30 years. Plotting the yields of bonds and treasury notes based on their years to maturity on the x-axis and the annual yield on the y-axis results in a simple graph called the "yield curve."
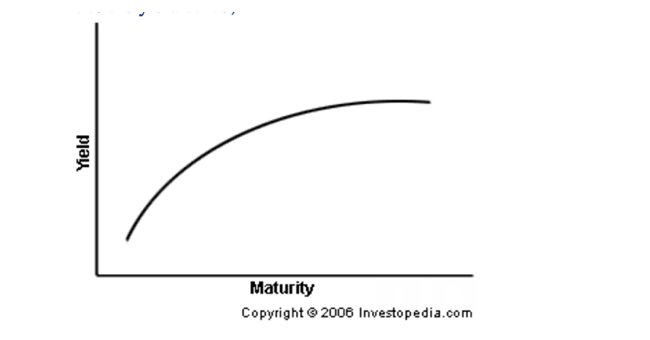
The yield curve graph plots interest rates paid by bonds and treasuries over time. Normally, it is an up-sloping line with lower interest rates in the near term and higher interest rates for longer terms. In an expanding economic environment, investors will seek more return the further out in time they go with their bond purchase because their money gets tied up at a specific interest rate which they believe is likely to rise.
If the yield curve begins to flatten or invert, it means longer term returns are expected to decline portending economic decline. Thus, if investors expect economic weakness, they go further out in time on the curve to lock in better returns i.e., the "flight to safety."
An inverted yield curve (when longer-term interest rates are lower than short-term rates) indicates a slowing economy or a recession.
 D. Crude Oil
Crude oil is priced in dollars on spot and futures markets for 1000 barrels per contract. There are a variety of crude oil grades. Most common quoted/traded are WTI (West Texas Intermediate) and U.K. Brent. A barrel is 42 gallons from which 19 gallons of gas and 12 gallons diesel/heating oil are refined. Crude is priced in US dollars and, like most commodities, crude prices are affected by relative dollar currency strength. Prices are subject to supply and a host of political issues. Generally, crude oil is a good economic barometer as most every product and service consumes energy. The US fracking extraction methods have revolutionized crude production making the US a net exporter of refined petroleum products. Crude prices are expected to range from $40 to $60 per bbl going forward
.png) E. Gold
E. Gold
Gold is an overall indicator of commodity prices, inflation expectations, economic uncertainty, and currencies. Gold is priced in USD and so it generally moves inverse to price changes of the dollar.
F. US Dollar
The US Dollar is the major reserve currency worldwide. It trades under various symbols (USD, DX, DXY) and varies by trading platform. These all track the dollar against a basket of other currencies, primarily the Euro. The dollar can be traded directly against the Euro on Forex under USD/EUR.
.png) UUP is an ETF for the US Dollar.
UUP is an ETF for the US Dollar.
There are many moving parts to currency markets but generally, a strong dollar indicates a strong US economy but tends to hurt large industrial companies with significant non-US sales. A weak dollar generally signals a weak economy but has an opposite positive effect for exporting firms.
A caveat: studies over a 20 year period indicate the dollar/stock correlation to be only .35 to .40. Dollar price moves generally affect commodity prices (gold, crude oil) in the short term.
2. Market Indexes
Approximately 4000 companies are actively traded on various exchanges in the US. These are tracked by a number of indexes. The most commonly followed are the Dow Jones Industrial Average and the S&P 500.
a. Dow Jones Industrial Average (DJIA)
The Dow Jones Industrial Average (DJIA) is a price-weighted average of 30 significant stocks traded on the New York Stock Exchange (NYSE) and the NASDAQ. The DJIA was invented by Charles Dow back in 1896. Over the years, companies in the index have been changed to ensure the index stays current in its measure of the U.S. economy. In fact, of the initial companies included in the average, only General Electric remains as part of the modern-day average.
The DJIA is price weighted so a $1 change for a $10 stock is much more significant (percentage wise) than a $1 change for a $100 stock. Because of price-weighting's associated problems, most other major indexes, such as the S&P 500 are market capitalization weighted.
We cannot buy or sell the DJIA but can trade proxy funds which mirror the index, e.g., DIA.
For a list of the DJIA components, click here.
b. Standard & Poor's 500 (SPX)
The S&P 500 is an index of 500 stocks deemed to represent US large capitalization equities. Unlike the DJIA, it is market-cap weighted reflecting the size of the company relative to the total index. The top four companies, by weight, are:
Company Weight
- Apple, Inc. 3.573773%
- Microsoft Corp. 2.481335%
- Exxon Mobile Corp. 1.705358%
- Amazon.com, Inc. 1.643649%
The S&P is quoted under the symbol SPX. You cannot buy or sell the SPX, but you can trade puts and calls on the index. The index can be traded via an exchange traded fund (ETF), SPY. The SPY is 1/10th the size of SPX. SPY also has options.
c. Nasdaq (NDX)
The NASDAQ 100 Index includes 100 of the largest domestic and international non-financial securities listed on the Nasdaq based on market capitalization. The Index reflects companies across major industry groups including computer hardware and software, telecommunications, retail/wholesale trade and biotechnology. It does not contain securities of financial companies including investment companies.
You cannot buy or sell the NDX, but options on NDX can be traded. An ETF – QQQ – can be traded and options on QQQ are also available.
d. Russell 2000 (RUT)
The Russell 2000 (RUT) is a small cap stock market index. It is the most common benchmark for mutual funds that identify themselves as "small- cap." In contrast, the S&P 500 index is used as a proxy for large capitalization stocks.
Again, as with SPX, you cannot buy/sell the Russell Index but can trade options on the RUT. A tracking ETF, IWM, can be purchased and has options.
3. Fundamental Analysis
 Benjamin Graham famously said,
"In the short run, the market is a voting machine but in the long run, it is a weighing machine.”
That quote refers to the difference between the price at which a stock trades versus the company's actual value. Because stock prices (market cap) and the company's actual value often differ, it is helpful to evaluate a company's stock price as if you were considering buying or selling the entire firm.
Earnings are key but not the only criteria. Other factors to consider: revenue, forward revenue and earnings estimates, margin, debt, cash, market share, competition, and management effectiveness.
The following are standard metrics for measuring financial health:
a. Earnings per share (EPS): Net income divided by total shares outstanding.
EPS can be stated as "operating earnings" or EBIT (earnings before interest, taxes and extraordinary items) or "non-GAAP" earnings. Actual earnings are reported as GAAP earnings (Generally Accepted Accounting Principles). GAAP earnings are often less than Non-GAAP earnings.
b. P/E Ratio: stock price divided by earnings per share.
There is no good or bad P/E. The ratio should be used as an indicator of valuation relative the market as a whole or more importantly, relative to competitors or relative to historical data. Very broadly, the P/E ratio tells you how long it would take to get your money back. In other words, if I purchased a company at a 20 P/E, it would take 20 years to return my original investment.
c. PEG Ratio: P/E Ratio divided by earnings growth rate.
A variation of the PEG ratio is to add the per share yield to the expected growth rate for the denominator. Generally, anything under 1 is attractive. As with P/E, the PEG ratio is a relative value measurement.
d. Dividend yield: annual dividend divided by stock price. Consider how long the company has paid dividends and if the dividend is regularly increased.
e. Free Cash Flow per Share
(Earnings + depreciation + amortization – capital expenditures – change in new working capital) divided by shares outstanding.
Cash flow measures liquidity. A healthy cash flow allows a business to meet regular obligations in a timely fashion. This metric is used commonly along with income. While income can be manipulated in financial statements, it is much more difficult to manipulate cash flow. The average price to cash flow ratio for the S&P 500 is approximately 11/1.
f. Net worth growth (or stockholders' equity growth): this is a good proxy measurement for the effectiveness of company management.
g. Long term debt to net worth: Debt is leverage and leverage increases risk. This ratio should be analyzed in context to the company and industry. Generally, a 1:1 ratio is common. A higher ratio warrants more investigation.
h. ROI (return on investment): net income divided by net worth. Generally, the higher the ROI the better, but note that this ratio can be increased by taking on more debt.
i. Shares outstanding – look for changes in shares outstanding over time. Is the company buying back shares or selling more shares and diluting shareholders?
j. Price to Book value – Share price per share divided by tangible book value per share. This is a very basic measure of company stock value.
k. Current ratio: current assets divided by current liabilities. This is a basic liquidity metric indicating a company's ability to pay its bills. 2:1 is a standard target.
4. Technical Analysis
Technical analysis is a process of evaluating stock prices using charts in a variety of ways. It is often criticized as "voodoo" with meaningless patterns in "squiggly lines." However, many investors and traders use it so it should not be ignored.
Volumes have been written about technical analysis. Used with fundamental analysis, it can be useful, especially in timing entries and exits.
Following are some common technical metrics:
- Moving averages such as the 50 day and 200 day moving averages of a security's price over a particular past period.
- Relative Strength (RSI): a momentum indicator measuring the speed and change of stock prices over a specific time period.
- Fibonacci Retracements: A mathematical method of determining support and resistance points over two price extremes.
- Resistance and Support: Levels used when analyzing stock charts for patterns to estimate price inflection points.