

Courtesy of Chris Kimble.

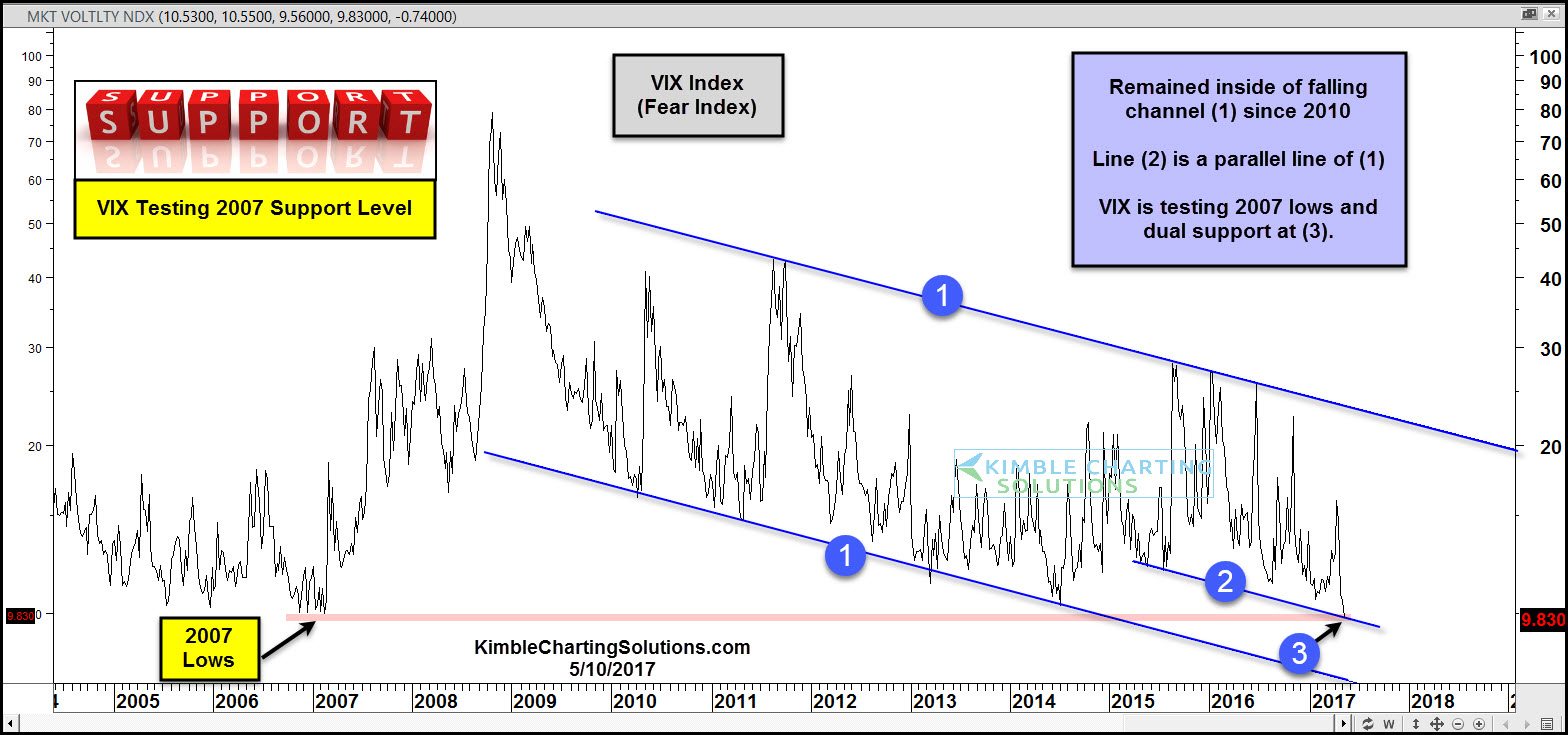
Below looks at the VIX index over the past decade. Over the past three weeks, the VIX has been falling sharply, over 40%. This decline has our attention from a Power of the Pattern perspective, see why below.
CLICK ON CHART TO ENLARGE
Over the past 7-years, the VIX has remained inside of falling channel (1). Line (2), is a parallel line of falling channel (1). The VIX index is now testing the lows of 2007 and line (2) at (3). When the VIX hit this level in 2007, it skyrocketed.
This price level could become a very important level for the VIX index and potentially could send an important message to the bullish trend in stocks.
The collapse in Fear has been great for ETF XIV, as it has rallied over 25% in the past three weeks. Premium and Sector members have been long the XIV trade and now they are harvesting gains and pulling up stops. See good news of fear collapse post (HERE).
To become a member of Kimble Charting Solutions, click here.