

 I can only tell you exactly what is going to happen – the rest is up to you!
On Monday, this is the range we drew for the S&P and, as I said in the Morning Report:
It's like we've simply zoomed in on the exact same chart but that "zoom" means we've cut 1.67% off the range and now the S&P is stuck in a 3% range, between roughly 2,600 and 2,700 and, if we zoom out a bit more, we see that tightening range is wedged right between the 200-day moving average at 2,611 and the 50-day moving average at 2,688 and the narrower this range gets, the more those averages squeeze together leading to a very exciting resolution at some point.
Remember, the 5% Rule™ is not TA, it's just math but we illustrate the math on charts – that's all they are good for, really. Charts tell you where you've been, not where you're going and, if you want to stay ahead of the market, you should use the 5% Rule™ – because it tells you which way the markets are heading. In January the 5% Rule™ told us the markets were wrong and the rally was overdone. That's why our Short-Term Portfolio is up 85% for the year – because we made the right bet at the right time.
On Monday morning, the chart predicted by our 5% Rule looked like this:
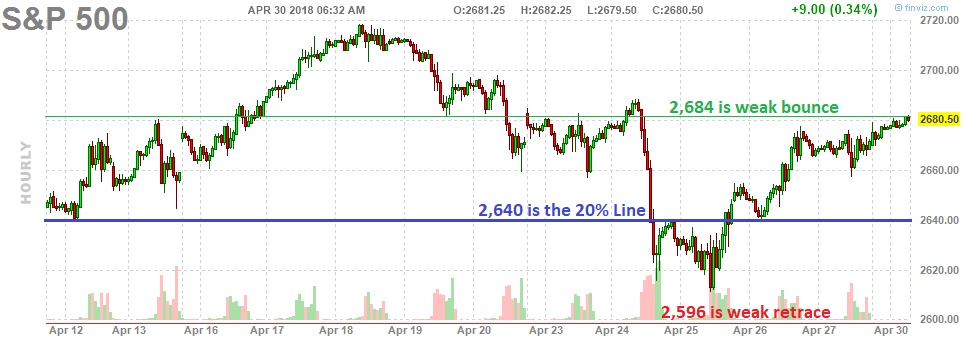
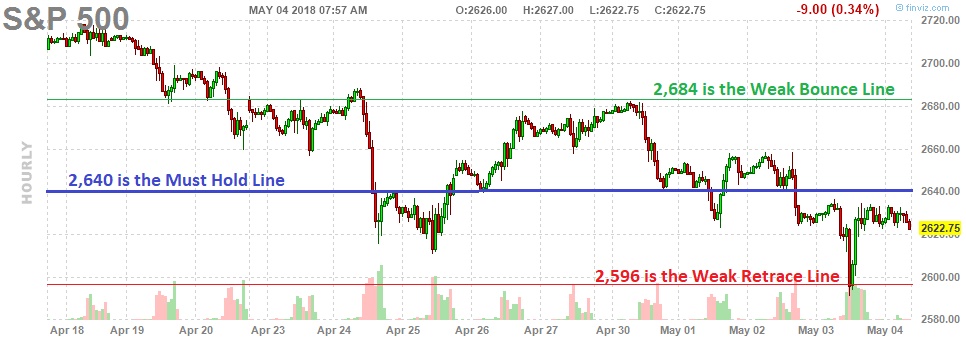
As you can see above, it turns out we had a perfect short on at 2,684 on /ES and then we fell right to the Weak Retrace line at 2,596, which was an 88-point drop and the S&P Futures (/ES) pay $50 per point, per contract so the gain from that play was $4,400 on the way down and then flipping positive at the bottom of the range paid another $1,500 per contract at 2,626 and now we'll see if this morning's Non-Farm Payroll Report can push us back to the higher end of the range.
It's useful to know what the trading range of an index is, right? Of course, using our 5% Rule along with our Fundamental Analysis, we can determine the ranges for commodies, ETFs, as well as individual stocks if they are liquidly traded (doesn't work as well with low-volumes). That makes it much easier to determine where the good entry and exit points are and it makes our trading MUCH more profitable. You can't "buy low and sell high" if you don't know what low and high are – right?

This morning we're waiting for the Non-Farm Payrolls report and the usual 200,000 jobs are expected even though last month only 103,000 jobs were added last month and that was supposed to be a one-time slow-down but I don't think it was as we're clearly at full employment (Unemployment below 4%) and rising wages make employers a bit slower to hire.
 8:30 Update: 168,000 is the official number and it's a little light but not terrible and payrolls are only up 0.2% so wage inflation is controlled. Neither of those things is likely to take the Fed off the table and we'll hear from Williams at 12:45 and then Kaplan, Bostic and George will do a panel at the Hoover Institute at 8pm titled: "Monetary Policy and Reform in Practice" and that will be a Hell of a market-mover. Too bad the markets and even the Futures will be shut down by then for the weekend…
We'll need to think a bit about what the Fed speakers will say to see if it's going to change our attitude (slightly bearish) into the weekend. Kaplan and Williams are centrists, Bostic is all over the place and Esther George is a reliable hawk so I'd say, if anything, we can expect bearish notes from the panel or certainly nothing to get bullish over. The NFP is also nothing to get bullish over and the week has been weak so why should today be any different?
:format(jpeg):mode_rgb():quality(90)/discogs-images/R-833861-1390150713-9403.jpeg.jpg) That means we're going to start out next week with negative spin, below the 20% line on the S&P and tesing the 200-day moving averages on the Dow (23,750) and the NYSE (12,468) and the S&P is only a hair above its own 200 dma at 2,615 and we've already poked below but FINISHING below these averages (2 of 3) would mean it's time to get shorter.
That means we're going to start out next week with negative spin, below the 20% line on the S&P and tesing the 200-day moving averages on the Dow (23,750) and the NYSE (12,468) and the S&P is only a hair above its own 200 dma at 2,615 and we've already poked below but FINISHING below these averages (2 of 3) would mean it's time to get shorter.
The Nasdaq is still the index that has dropped the least, still up near the 25% line (6,750) while the broader NYSE has already failed it's Must Hold Line and is now possibly failing the 200 dma! The Nasdaq's 200 dma is 6,369 so about a 250-point drop at $20 per point, per contract means you can make $5,000 per contract in a 5% dip in the Nasdaq Futures (/NQ) while stopping out above 6,650 would be a 15-point loss from here (6,635) or $300.
Risking $300 to make up to $5,000 is what we call a positive reward/risk ratio and are exactly the kind of bets we look to make at PSW. If you can't play the Futures, the Ultra-Short ETF for the Nasdaq (SQQQ) is a primary hedge for us but, as a short-term play, with SQQQ at $17.39, the May $16 calls are $1.50 and the May $17 calls are $1.05 so net 0.55 on the $1 spread that expires on the 18th will pay you 0.45 (81%) in two weeks if SQQQ doesn't fall below $17 (the Nasdaq would have to go higher).
So let's say you put $550 into 10 of those contracts, the return would be $1,000 for a $450 profit at $17 or higher. That's all it takes to play options and that's why we are able to make such ridiculous returns in our Short-Term Portfolio – we simply take advantage of easy set-ups like this one.
Hedges like this make nice little insurance policies if you are worried about your longs over the weekend but would prefer not to cash them out. If all is well on Monday, it's not likely the spread will be below 0.30 and that means you can take a $250 loss and be done with it. If the Nasdaq is still weak, however, you can just stick with the bet and make 81% in 14 days.
Have a great weekend,
– Phil