

What Have You Done For Me Lately?
Courtesy of Michael Batnick
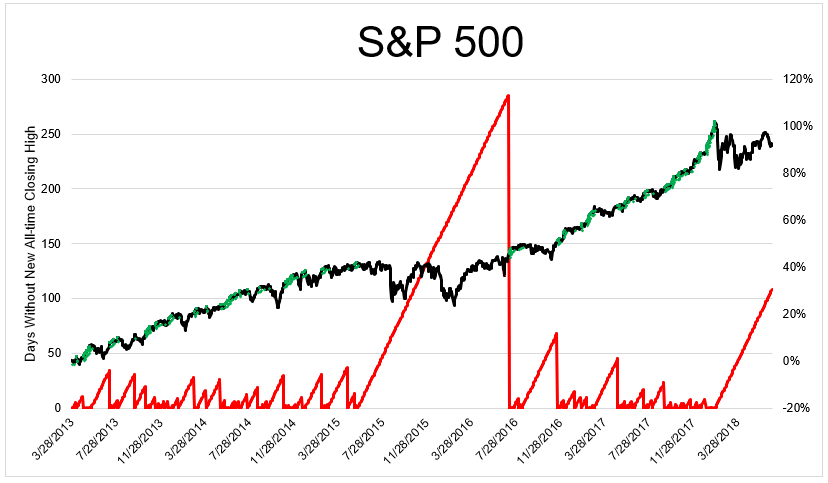
The S&P 500 has gone 108 days without closing at an all-time high. This is the second longest drought since the index first made new highs in March, 2013.
The chart below shows the days without an all-time closing high (red), the S&P 500 return (black), and new all-time closing highs (green).
On March 28, 2013, the day the S&P 500 finally made an all-time high, The Wall Street Journal described the debate that dominated financial markets:
“On one side, Italy’s difficulty in forming a new government stoked fears that Europe still hasn’t dealt with its financial problems, despite the reopening of Cyprus’s banks. In addition, new U.S. weekly unemployment claims surprised economists by ticking higher while another report showed soft manufacturing activity in the Midwest.”
The article also included some serious bear porn.
“Ordinary investors began pushing money back into U.S. stock mutual funds in January and February. Many had sold during the crisis and some appeared to regain confidence as indexes neared records, meaning some had sold low and bought high.”
Aside from the anecdote that “ordinary investors” were returning, which always gets more attention than it deserves, there were plenty of legitimate reasons to be skeptical that the rally would continue. The S&P 500 had compounded at 25.6% for the previous four years, and with a CAPE ratio of 23, they were no longer a bargain. On top of that, the economy wasn’t doing great. Jobless claims were 357k, unemployment was 7.5%, and the most recent GDP report showed an annual increase of just 0.4%. And of course, one can’t forget that all of the gains in the market was due to quantitative easing, which many feared was blowing another bubble into assets.
It was perfectly reasonable to suspect that stocks had run too far too fast, or that the money, easy or otherwise had already been made.
But in the five plus years since March 2013 the index (TR) has compounded at 13.2% per year. Remember, this is after gaining 26% per year over the previous four years (148% total). So it’s really okay if we go another 100 or 200 or even 300 days without a new high.
Stocks fall into the what have you done for me lately category, but if you define lately as in last few years instead of last few weeks or months, they’ve done plenty.