

"Well we know where we're going
But we don't know where we've beenWe're on a road to nowhere
Come on inside
Taking that ride to nowhere
We'll take that ride" – T Heads
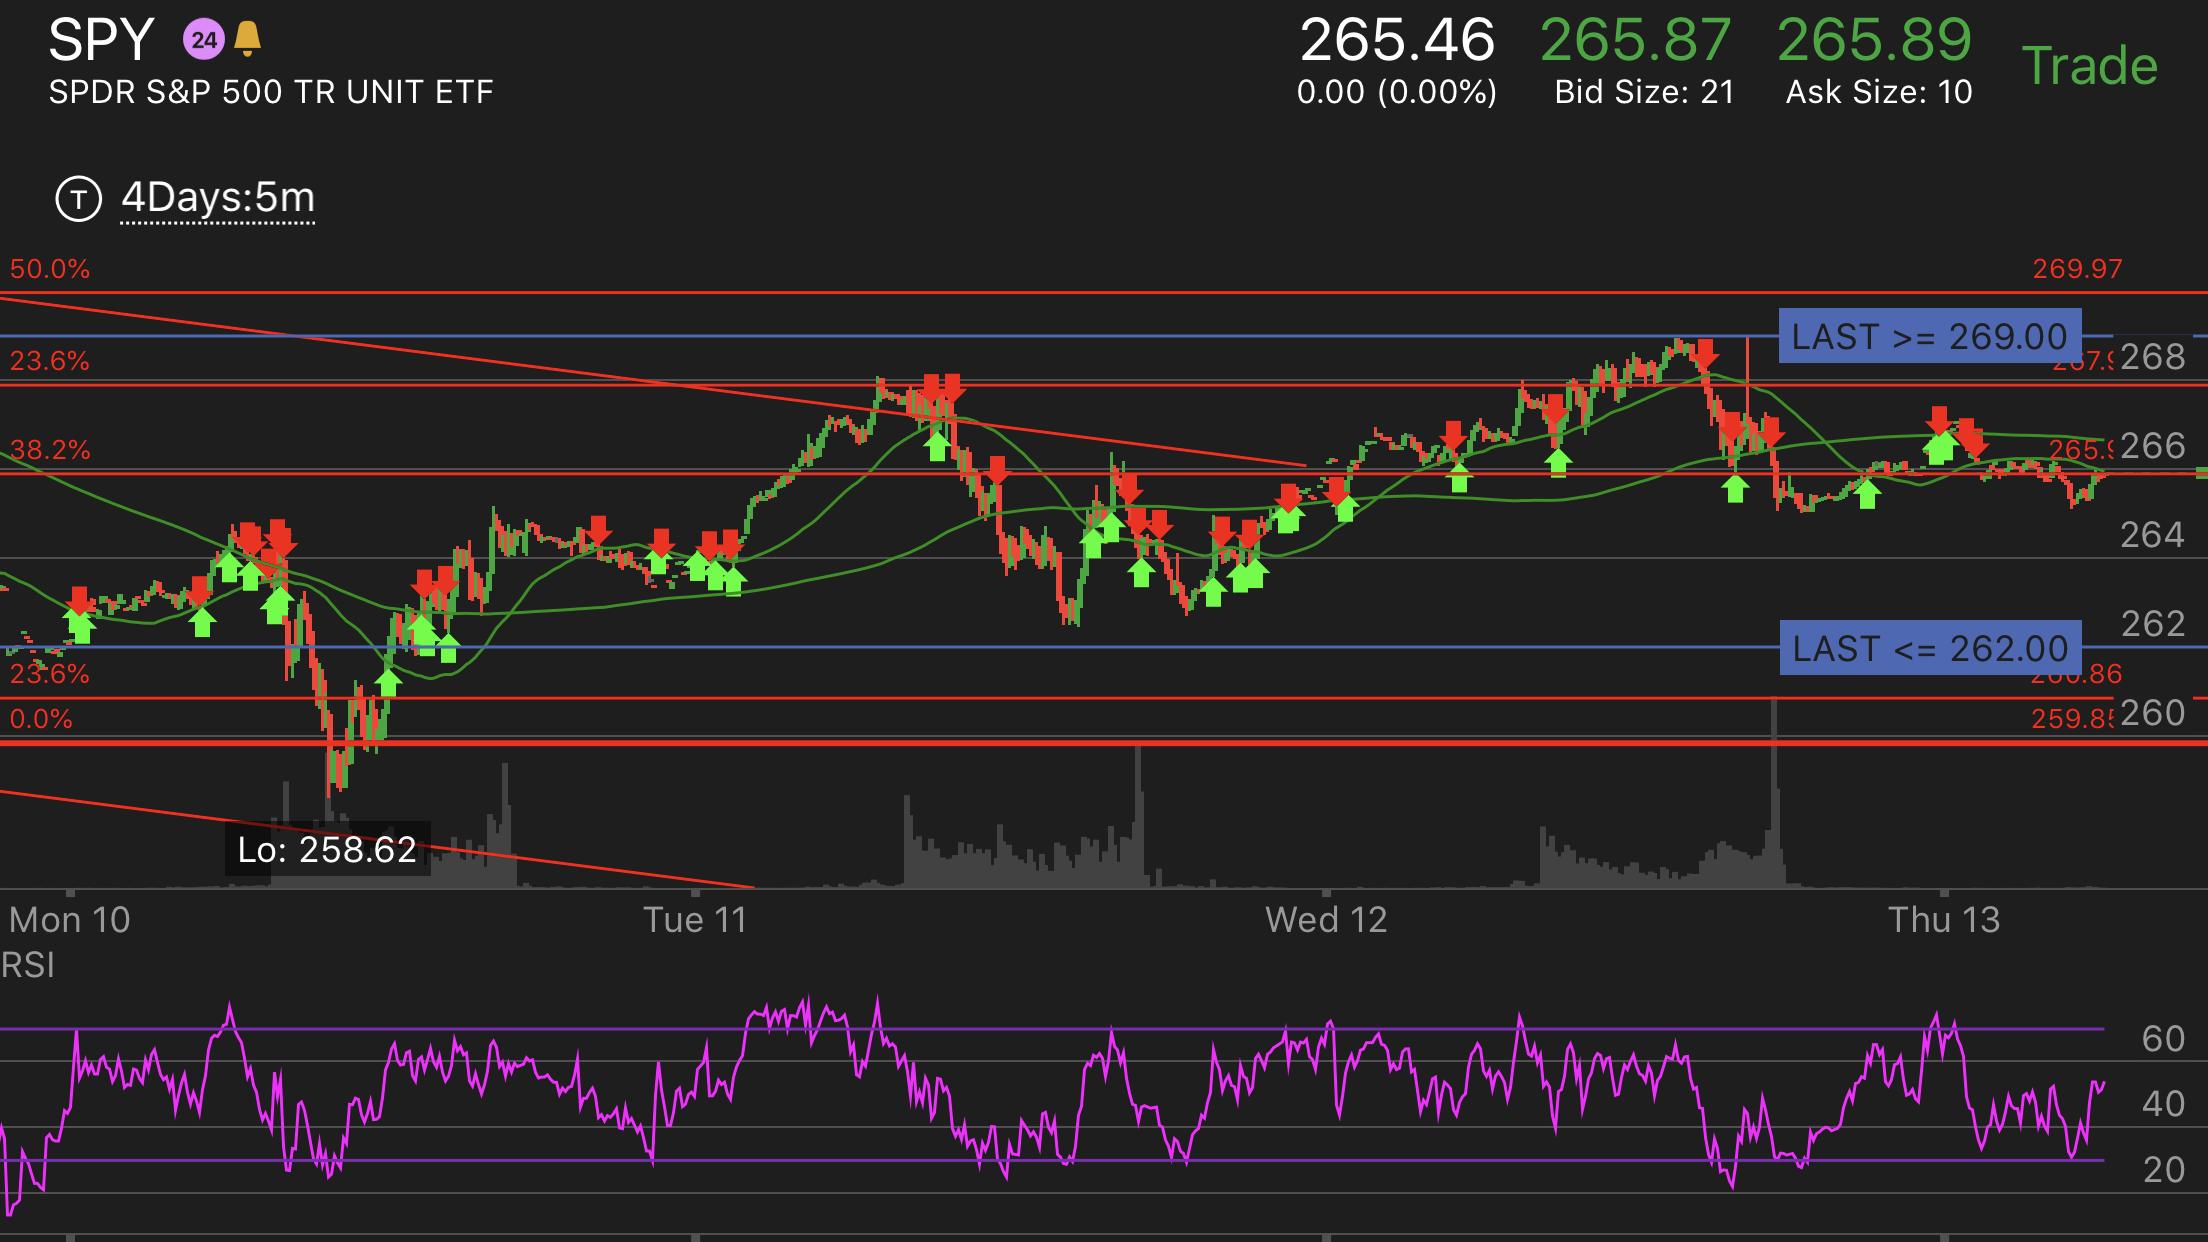
As you can see frojm they S&P ETF (SPY) chart, we haven't done much of anything since Monday's open but it has been an exciting week as the S&P has had a 100-point trading range (4%) but each of these exaggerated moves in the Futures, whether up or down, seems to get dragged back to the middle once the real trading sessions (with volume) begins.
| Date | Open | High | Low | Close* | Adj Close** | Volume |
|---|---|---|---|---|---|---|
| Dec 12, 2018 | 267.47 | 269.00 | 265.37 | 265.46 | 265.46 | 97,760,100 |
| Dec 11, 2018 | 267.66 | 267.87 | 262.48 | 264.13 | 264.13 | 121,504,400 |
| Dec 10, 2018 | 263.37 | 265.16 | 258.62 | 264.07 | 264.07 | 151,445,900 |
| Dec 07, 2018 | 269.46 | 271.22 | 262.63 | 263.57 | 263.57 | 161,018,900 |
| Dec 06, 2018 | 265.92 | 269.97 | 262.44 | 269.84 | 269.84 | 204,185,400 |
| Dec 04, 2018 | 278.37 | 278.85 | 269.90 | 270.25 | 270.25 | 177,986,000 |
| Dec 03, 2018 | 280.28 | 280.40 | 277.51 | 279.30 | 279.30 | 103,176,300 |
Other than yesterday, volume this week has been much stronger than the sub-100M on SPY we routinely posted in November and this could be a good sign that we're consolidating along the -10% line, which is really nothing more than a healthy correction of a rally that's been going on since early 2016, when the S&P double-bottomed at 1,800.
In the bigger picture of the weekly chart, we're simply double-bottoming at 2,600, where we bottomed out last year before making the 10% climb that we've now reversed and this all makes perfect sense since 1,800 x 150% is 2,700 and it's very, very hard for an index to move up 50% without some sort of correction – the move to 2,950 was simply an overshoot that never should have happened.
 As I noted in yesterday's Live Trading Webinar, most of the gains we've had over 2,400 have been due to Trunp's disastrous tax cuts, which allowed many corporations to take massive write-offs last year that have distorted their earnings – not to mention artificially low taxes are themselves an earnings distortion. What do I mean by that? I mean that the tax cuts are unrealistic as we're running a deficit of 5% of our GDP (over $1Tn /yr), which would cause us to be automatically sanctioned if we were in the EU as we're over their deficit limit by 150%.
So, if our negligent collection of Corporate Taxes is causing/contributing to a massive budget deficit, then the low taxes are, logically, unsustatianable – the only question is how close to bankruptcy does the country have to get before we get realistic about our spending and saving habits? Fortunately, our current President is just the right guy to find that out with as he's driven 5 companies into Bankruptcy and dozens more to the brink – hopefully we'll be one of his lucky gambles…

It's pretty clear from the chart above that Corporate Taxes are directly related to deficits and the impact is far, far worse than it seems because, yes, we collected 50% less ($150Bn) corporate taxes this year than in 2016 but that's only half the picture as PROFITS were much higher so we should have been collecting more like $600Bn, not $150Bn and that $450Bn would have halved the 2018 deficit.
And keep in mind that's not even including the hundreds of Billions of taxes that were not paid by Trump and his top 0.1% buddies, who also make record amounts of money while paying record low taxes. It doesn't matter if Trump gets impeached – he's done his job and allowed the Top 0.1% to cash out of the market at the top while paying as little money as possible and now they will wait patiently for the market to fall and wipe out the bagholders so they can step in again and buy when it's cheap.
Speaking of cheap stocks being accumulated by rich people, I've been banging the table on GE (GE) and we just made aggressively bullish adjustments in our Long-Term Portfolio as well as our Options Opportunity Portfolio and FINALLY, just this morning, JP Morgan became the first analysts in ages to say perhaps the selling is a bit overdone at this point.
Let's not pop the champagne just yet as Steve Tusa only raised his rating to neutral from "underweight" but Tusa has led the bear charge on GE and we finally won him back at $6.66. Tusa says the industrial giant now has a more "balanced risk reward at current levels," saying: "Key to the story, in our view, is the outcome of 'known unknowns' in near term, which are better understood and around which debate is more balanced, as opposed to being overlooked by most bulls in the past."
Sure if this were a teacher saying "nice" things about my kid, I'd be very concerned but as long as GE doesn't go BK, I'm very happy to accumulate them down around $7 which is a $60Bn valuation for a company with $120Bn in sales which led to $9Bn in profits in 2016 and 2014 but write-downs made them negative this year, last year and in 2015. I've been willing to forgive GE for restructuring but, until now, my analyst peers have not.
As a new trade on GE, I would go with:
- Sell 20 GE 2021 $8 puts for $2.30 ($6,300)
- Buy 50 GE 2021 $5 calls for $3.70 ($18,500)
- Sell 50 GE 2021 $8 calls for $2.25 ($11,250)
So our target is, of course, $8 and anything below $8 means we end up having to buy 2,000 shares of GE at $8 ($16,000) plust the $950 cash we lay out for the spread so $8.19 would be our net if below $8 but, since we own the $5 calls, our breakeven is the average of ($8.18 + $5) / 2 or $6.59 per share but our worst case is GE being below $5 and then our shares flat out cost $16,950. The reward is that, at $8, you will get $15,000 back for a gain of $14,050 and it doesn't seem like much of a stretch to imagine GE can make $8 in two years (it's $7.40 this morning), so I love this trade for a potential 1,478% return on cash.
Market-wise, we're still watching our bounce lines to see what sticks but Draghi was very doveish at the ECB meeting and the indexes are moving up about 5% early this morning though these things tend not to stick so let's just hope we don't end up lower into tomorrow's close or we'll have to get more bearish into the weekend. There's really been no improvement since Monday's close so what we said about the levels on Tuesday morning still stands.
- Dow 24,300 with a weak bounce at 24,800 and a strong bounce at 25,300
- S&P 2,640 with a weak bounce at 2,710 and a strong bounce at 2,780
- Nasdaq 6,870 with a weak bounce at 7,080 and a strong bounce at 7,230
- Russell 1,485 with a weak bounce at 1,530 and a strong bounce at 1,575
- NYSE 11,880 with a weak bounce at 12,150 and a strong bounce at 12,400
