

By Jacob Wolinsky. Originally published at ValueWalk.
DoubleLine Rising Rate Funds Webcast with Portfolio Managers Philip Barach and Robert Cohen for the month of February 2019, looking at the historical yield curve comparison.
TAB I – Market Overview
U.S. Interest Rates

Source: Bloomberg
You cannot invest directly in an index.
Q4 hedge fund letters, conference, scoops etc
U.S. Yield Curve: 2017 vs. 2018
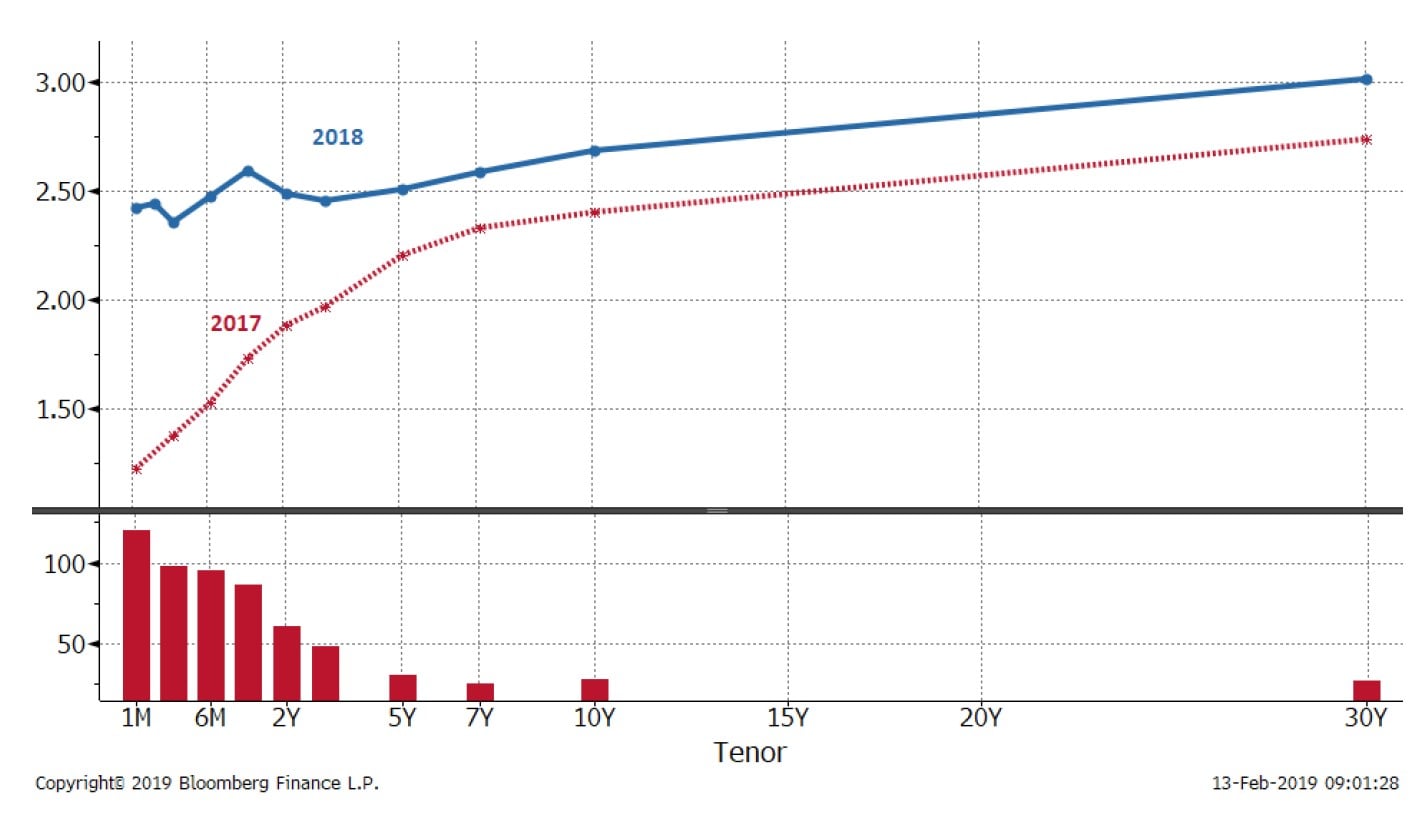
Source: DoubleLine, Goldman Sachs
The chart is a historical yield curve comparison between 12/31/2017 and 12/31/2018.
S&P/LSTA Leveraged Loan Index is designed to reflect the performance of the largest facilities in the leveraged loan market. A-BBB are credit ratings by Standard & Poor’s.
U.S. Yield Curve: 2017 vs. 10 months into 2018
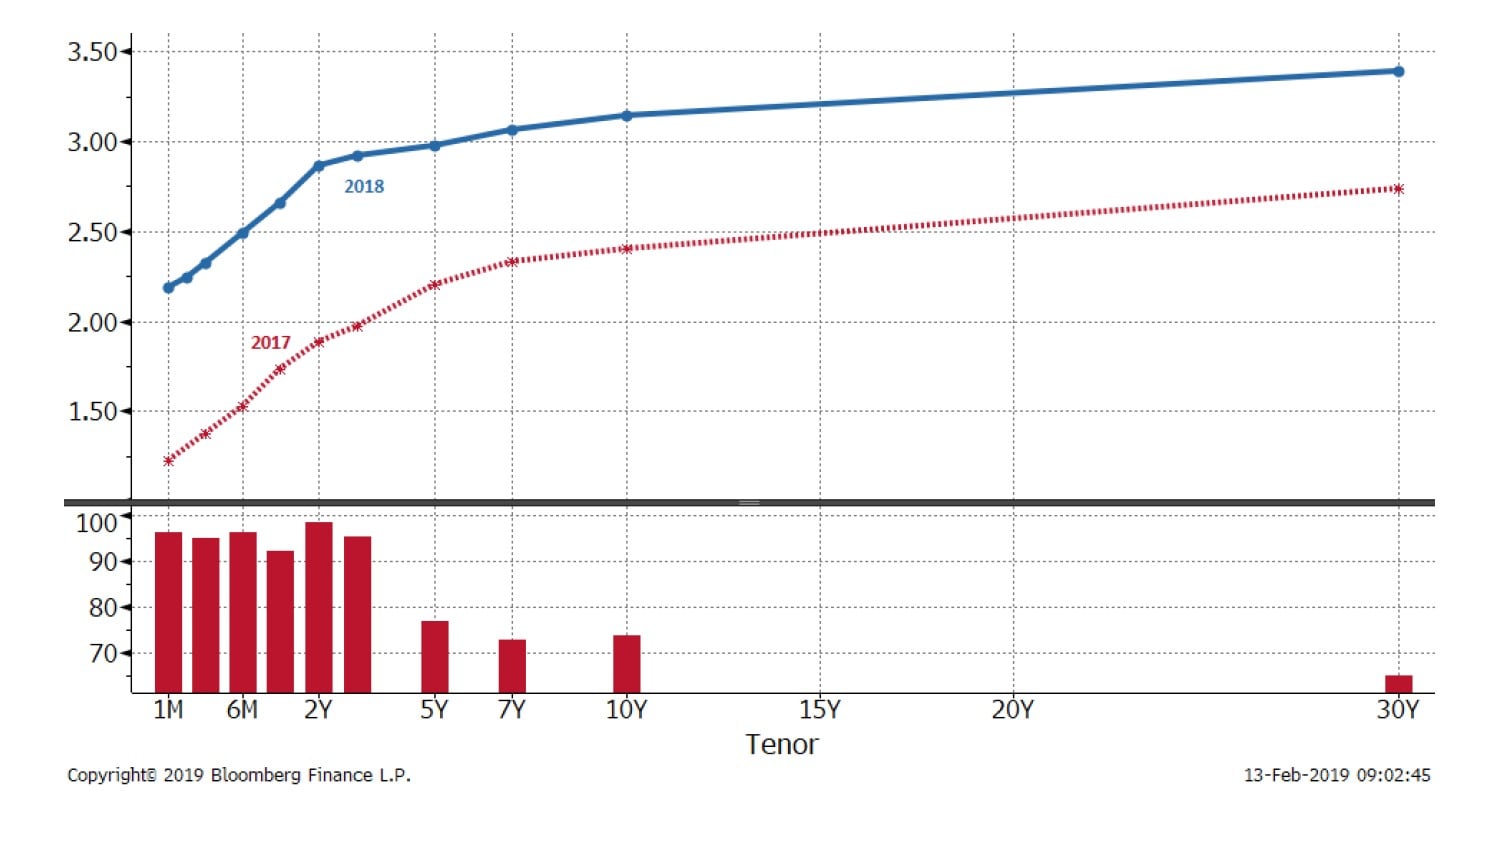
Source: DoubleLine, Goldman Sachs
The chart is a historical yield curve comparison between 12/31/2017 and 12/31/2018.
S&P/LSTA Leveraged Loan Index is designed to reflect the performance of the largest facilities in the leveraged loan market. A-BBB are credit ratings by Standard & Poor’s.
U.S. Yield Curve: Last 2 months of 2018 vs. 2018
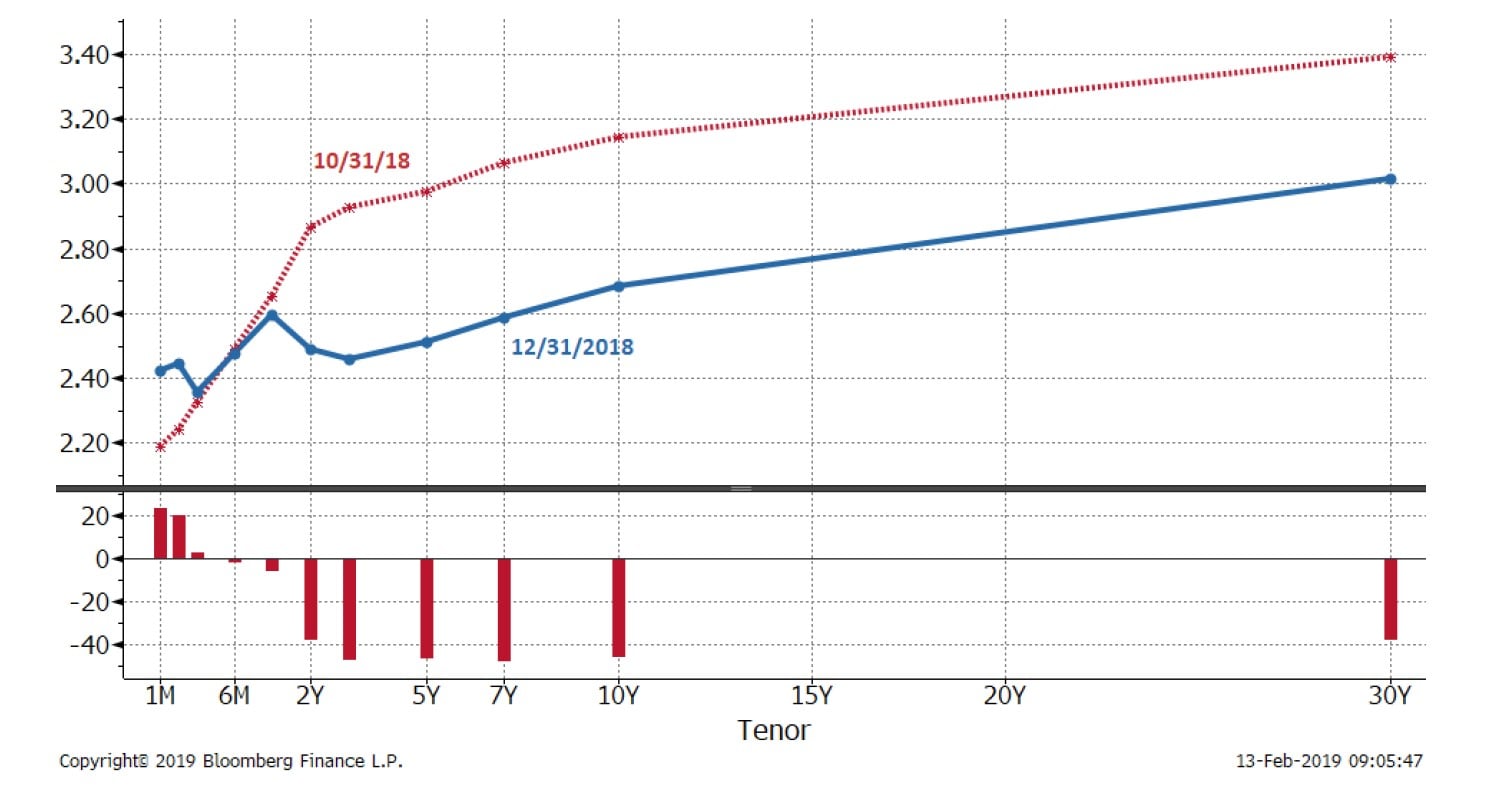
Source: DoubleLine, Goldman Sachs
The chart is a historical yield curve comparison between 12/31/2017 and 12/31/2018.
S&P/LSTA Leveraged Loan Index is designed to reflect the performance of the largest facilities in the leveraged loan market. A-BBB are credit ratings by Standard & Poor’s.
Fed Dots vs. Market Expectations 2018, 2019, & 2020
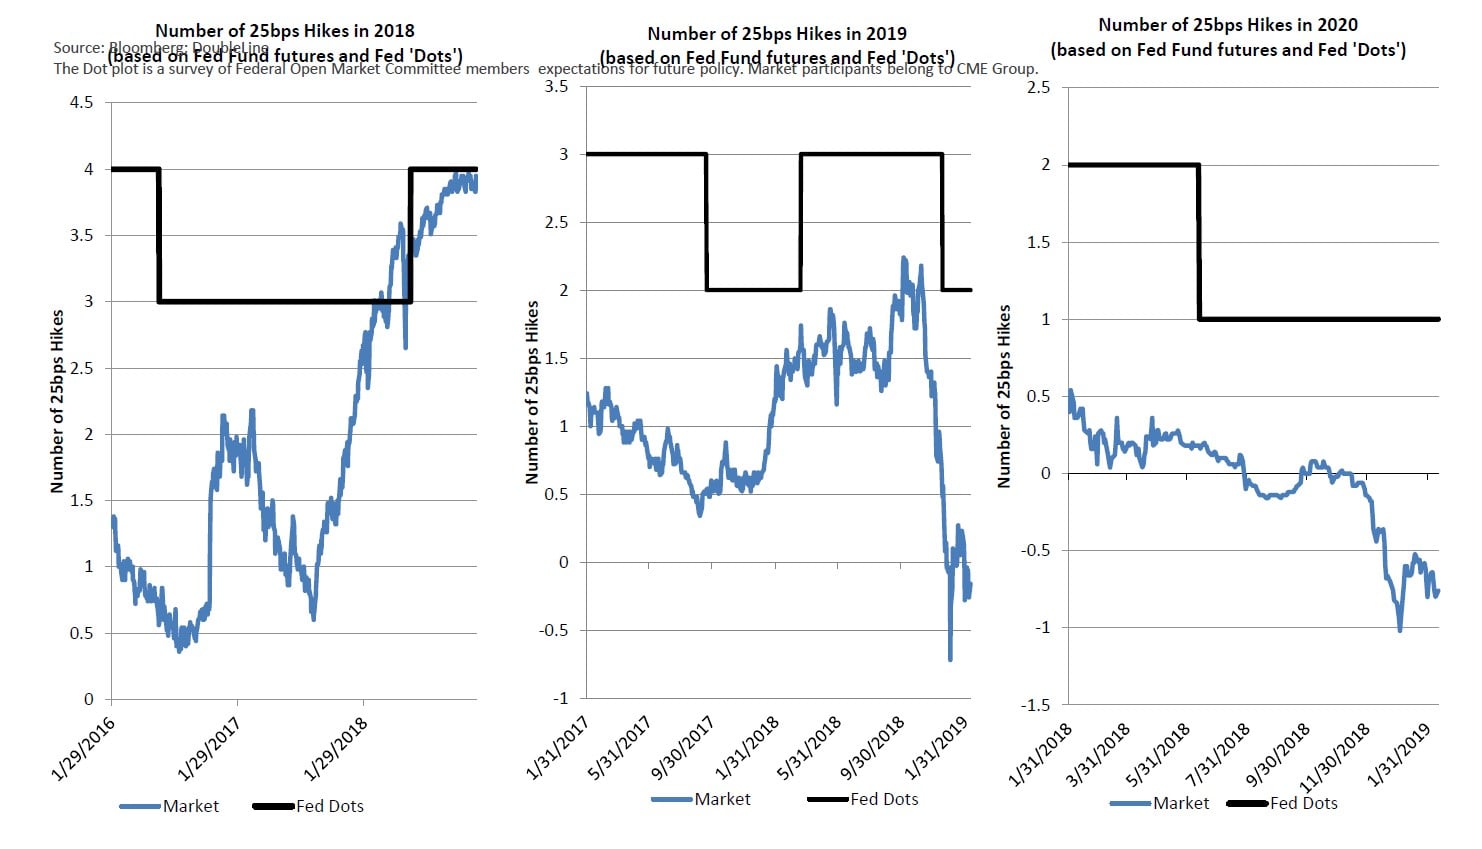
U.S. Rate Hike/Cut Odds (Bloomberg WIRP)
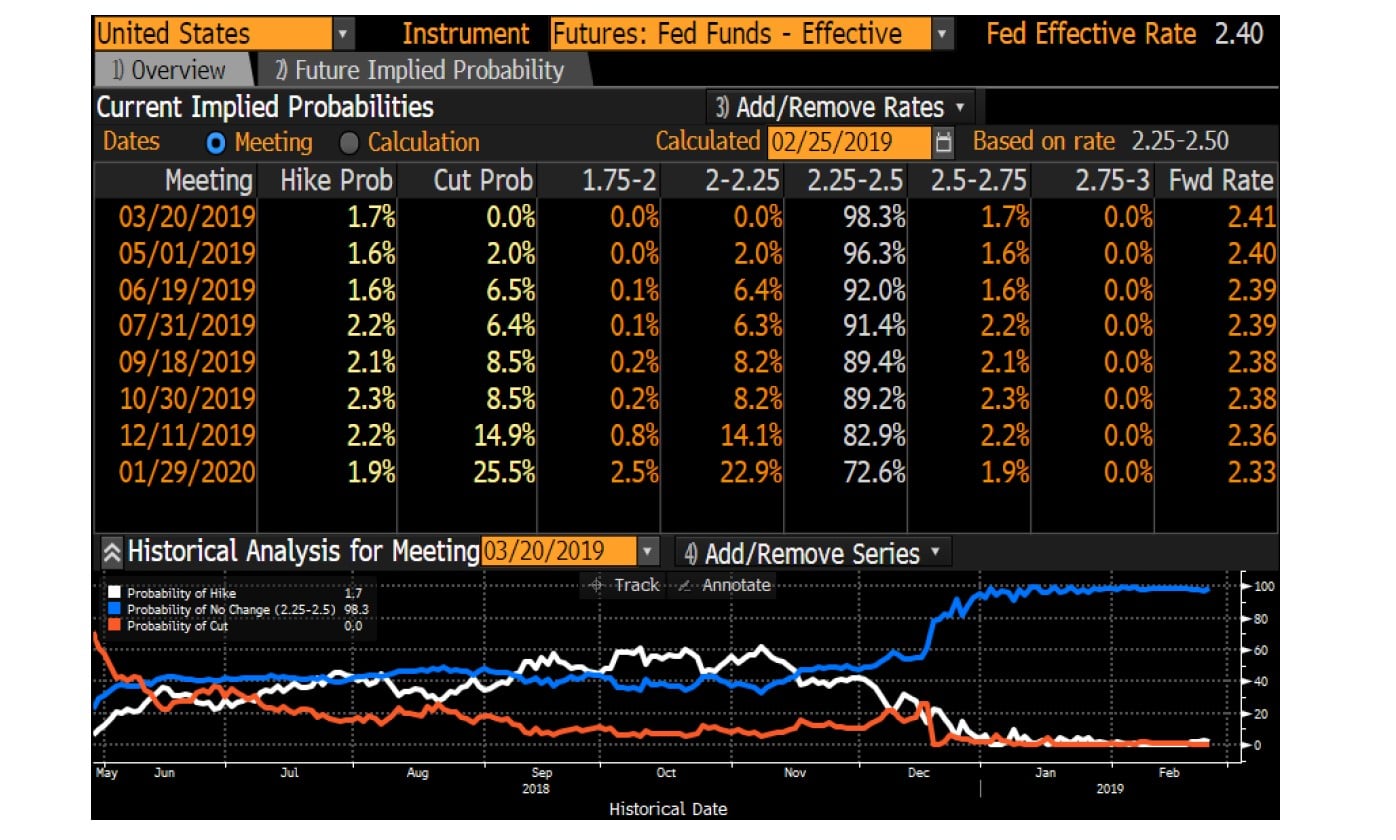
Source: Bloomberg, DoubleLine
Global Real GDP Growth YoY

Source: Bloomberg, DoubleLine
Please see appendix for index definitions. You cannot invest directly in an index.
2s10s and Recessions
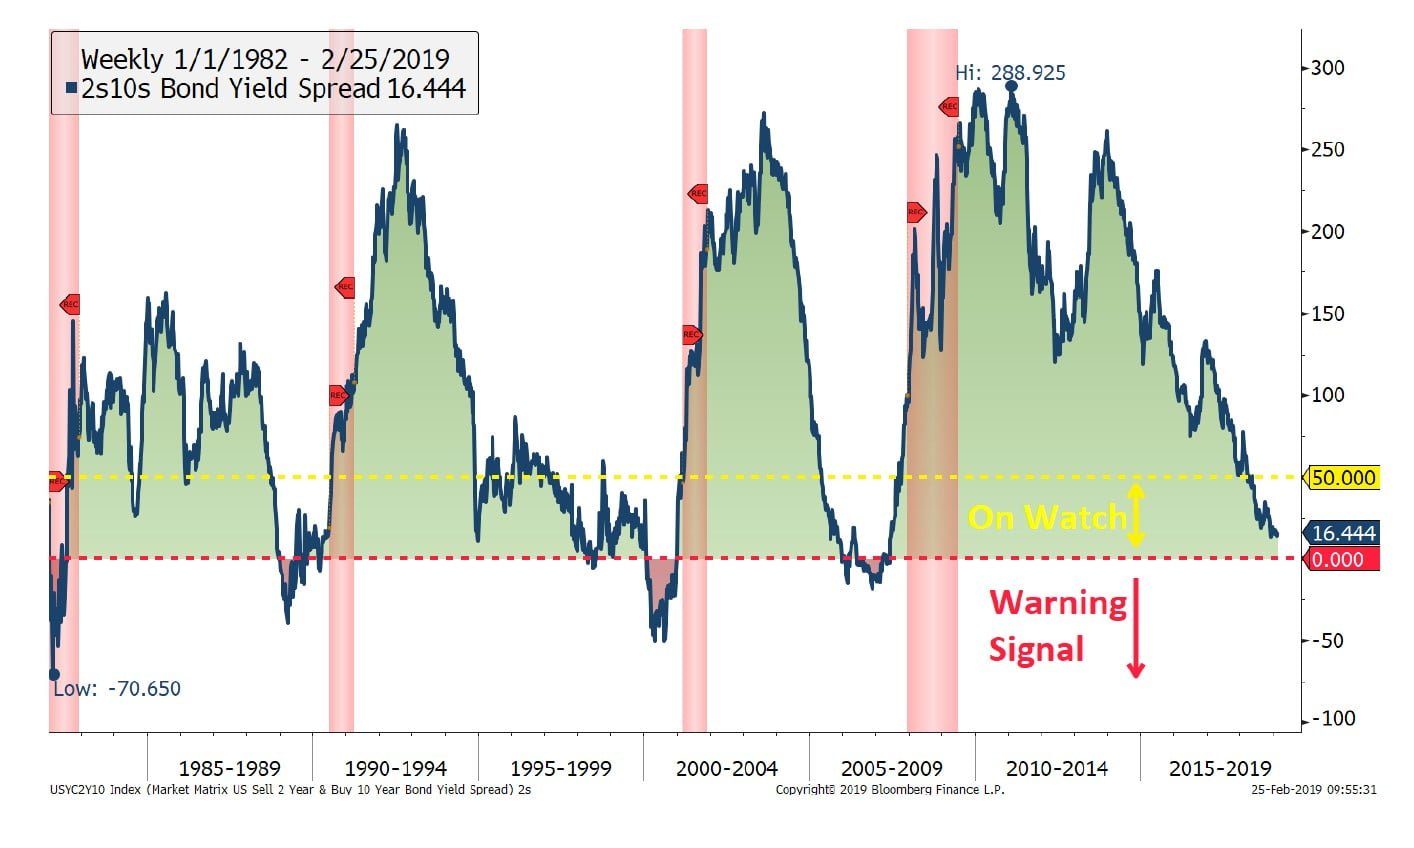
Source: Bloomberg, DoubleLine
U.S. Conference Board Leading Economic Indicator
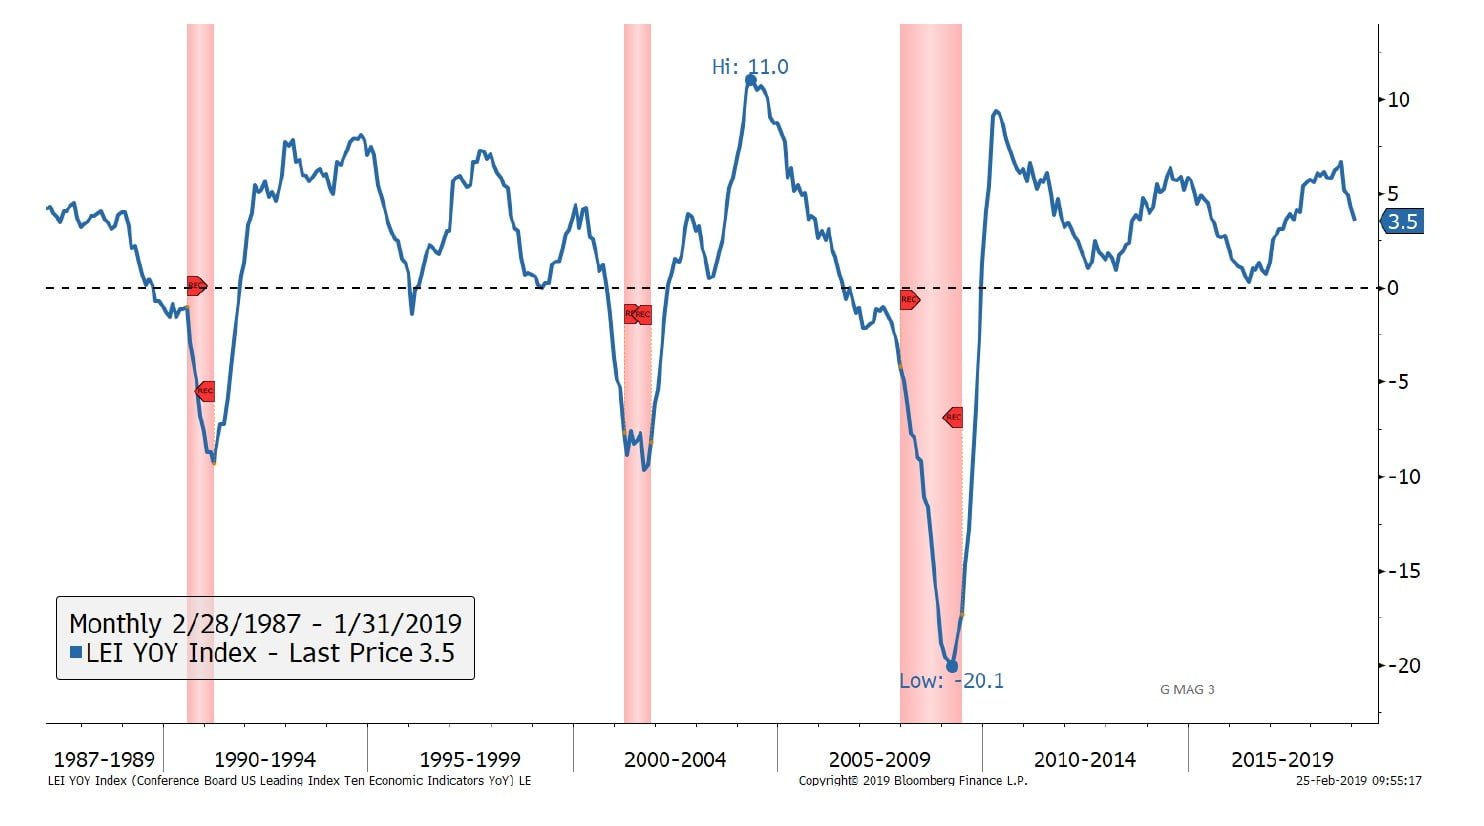
Source: Bloomberg, DoubleLine
Conference Board U.S. Leading Index = indicators include economic variables that tend to move before change in the overall economy. These indicators give a sense of the future state an YoY = year-over-year. You cannot invest directly in an index.
U.S. Industrial Production
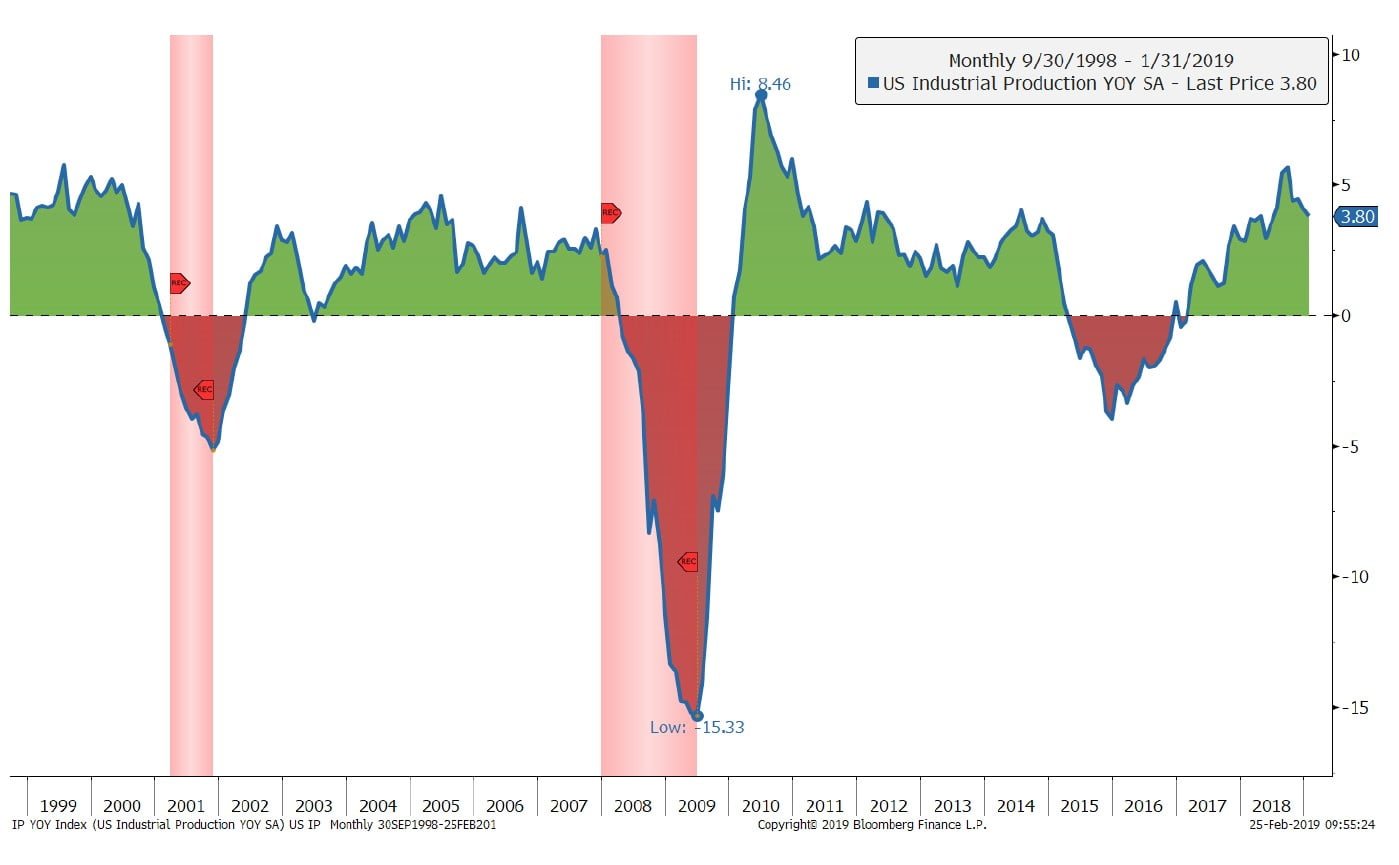
Source: Bloomberg, DoubleLine
Red shaded areas indicate recessionary periods.
U.S. Manufacturing and Services PMI
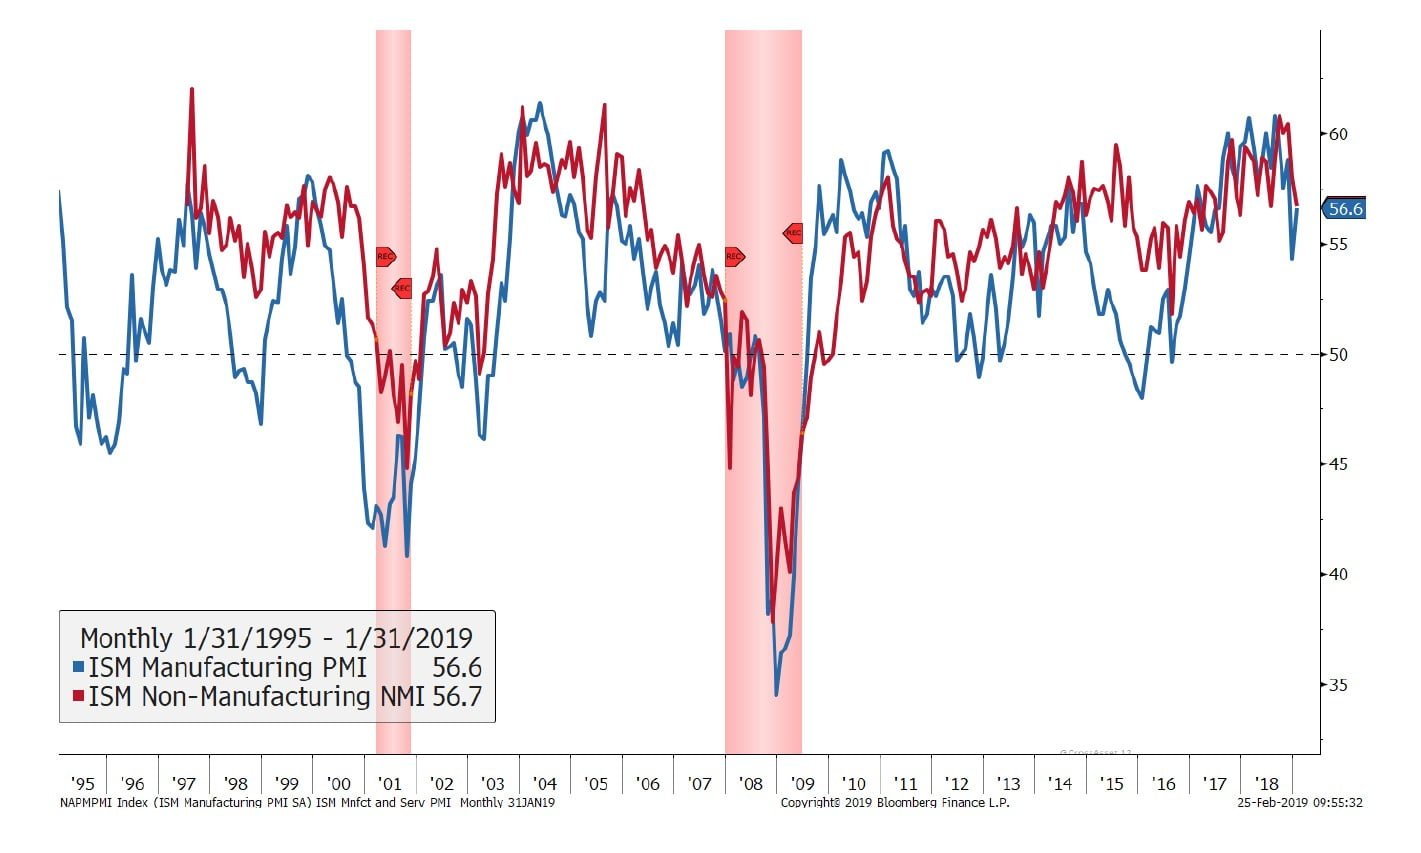
Source: Bloomberg, DoubleLine, ISM
ISM Manufacturing Index is based on surveys of more than 300 manufacturing firms by the Institute of Supply & Management. PMI = Purchasing Managers’ Index is an indicator of the economic health of the manufacturing sector based on five major indicators: new orders, inventory levels, production, supplier deliveries and the employment environment. You cannot invest directly in an index.
See the full slide below.
The post DoubleLine: Yield Curve Danger? appeared first on ValueWalk.
Sign up for ValueWalk’s free newsletter here.


