

The Market Gapitalization
Courtesy of Michael Batnick
A report that I look forward to reading, okay skimming, every year is the Credit Suisse global investment returns yearbook.
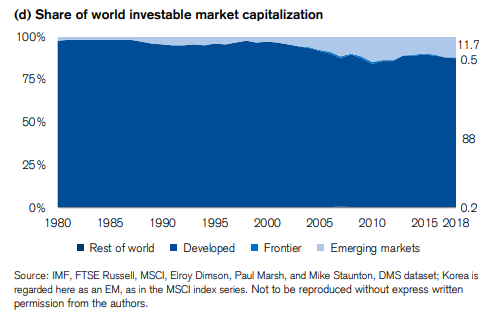
One of the more remarkable statistics in the new release can be found in emerging and frontier markets. These countries account for 40% of world GDP and 68% of the world population, yet they represent just 12% of the world’s investable market capitalization.
The report shows the loooong-run returns of emerging markets compared to developed ones. This chart is a great example of why I find “growth of $1” to be somewhat misleading.
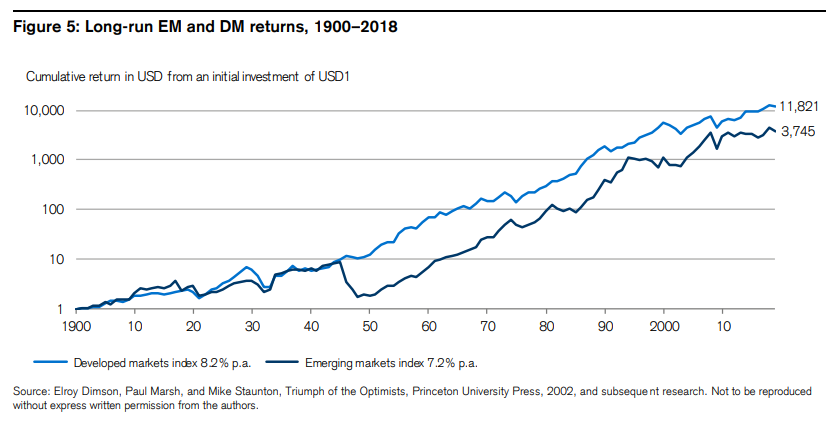
You can see that they were running neck and neck from the start of the 20th century through the end of WWII. And then, “From 1945–49, emerging markets collapsed. The largest contributor was Japan, where equities lost 98% of their value in US dollar terms. Another contributor was China, where markets were closed in 1949 following the communist victory, and where investors effectively lost everything.”
The post WWII period had enormous implications for long-term returns. If this chart began in 1950, $1 in emerging markets would have grown to $2,069 as opposed to just $968 in developed markets.
There’s a ton of other good stuff in the report. Hit the link below for the whole shabang.