Why The Fed Rigs the Stock Market – Chart
Courtesy of Lee Adler, The Wall Streeet Examiner
Here’s a chart that shows you exactly why the Fed rigs the stock market using QE, low interest rates, and propaganda jawboning.
The Fed has a dual mandate– stable prices (har de har) and full employment. For some reason the Fed has redefined “stable” prices as 2% inflation, but that’s a subject we’ve already beaten to death. And we will continue to beat it to death.
But I haven’t looked as much at the issue of Fed policy and employment. The Fed has clearly figured out that there’s a correlation between stock prices and employment levels. Whether it’s causal or not is an argument that others can have. The high priests of Economism and they obviously think that it’s causal. Ben Bernanke laid out the rationale for it in a famous 2010 Washington Post oped.
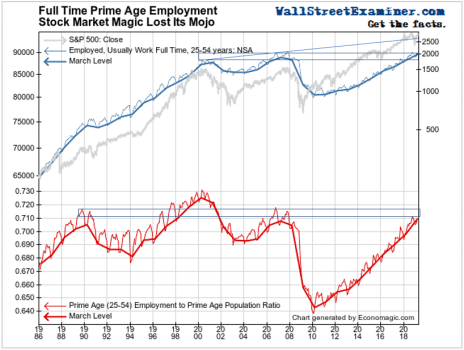
No matter that the jobs being created are shitty, low paying gig work, with no benefits and no security. The Fed can point to charts like this and say, “See! We did it!” This is a chart of full-time prime age (25-54) employment, and its percentage of prime age population.
This Chart Shows Why The Fed Rigs The Stock Market

Correlation? You bet! With a lag, even. Economism priests are fond of saying that monetary policy works with a lag. The Fed tightened in 2000. The stock market went down. And full time prime age employment followed. The Fed eased in 2003 on the heels of a two year bear market. The stock market reversed. Employment followed in a few months.
But oops, what’s this. The Fed tightened and the stock market topped out in 2007. But employment moved concurrently. By 2008, the Fed was frantically throwing every magic trick that it could think of to ease financial conditions without success. The stock market kept plunging, and employment moved concurrently.
Finally in early 2009, the Fed tried pumping hundreds of billions of dollars directly into the accounts of Primary Dealers to get a stock market response. That worked. Thus was born the 10 year era of ZIRP (zero interest rate policy) and outright QE.
But employment stayed dead in the water until 2013. You want to call 4 years a lag effect? I call bullshit. Sooner or later the natural rhythms of economic contraction and expansion assert themselves. That was what this recovery was. I have felt that QE and ZIRP slowed the recovery, because it reduced discretionary spending of retirees and others who supplemented their income with interest income.
The Fed ended QE in late 2014, but the ECB and BoJ had taken the handoff. They began printing massive amounts of money in their renewed QE programs around that time. All financial pipelines ultimately pass through Wall Street, and that foreign money was more than enough to keep the stock market ramping. Jobs continued to rise.
And now, after 10 years of this hocus pocus crap, full time prime age employment is finally back to where it was 12 years ago. The Fed and mainstream economists give credit to QE and ZIRP. But how do we know? Maybe if they had not confiscated the savings of seniors and others and transferred their wealth to bankers and speculators, the economy would have healed faster. We’ll never know.
In the meantime, over that 10 years, prime age population grew. Today, the ratio of full time prime age employment to prime age population is only back to where it was 12 years ago. It’s still below the peaks reached in 2003.
So the Fed thinks it has been successfully in spurring job creation. And that is its justification for rigging the stock market to go higher, and drive valuation measures into the stratosphere. I’ll let you be the judge on whether this is a good thing. You know where I stand.
Meanwhile, the question of how long this shell game continues is a matter for liquidity analysis and technical analysis.
|
Liquidity is money. Regardless of where in the world that money originates, eventually it flows to and through Wall Street. So if you want to know the direction of the next big moves in stocks and bonds, just follow the money. Lee Adler's Liquidity Trader tracks and analyzes the monetary forces that drive markets, like the daily real time Federal Withholding taxes shown in this chart. Try it for 90 days, risk free! |


