

Courtesy of Chris Kimble
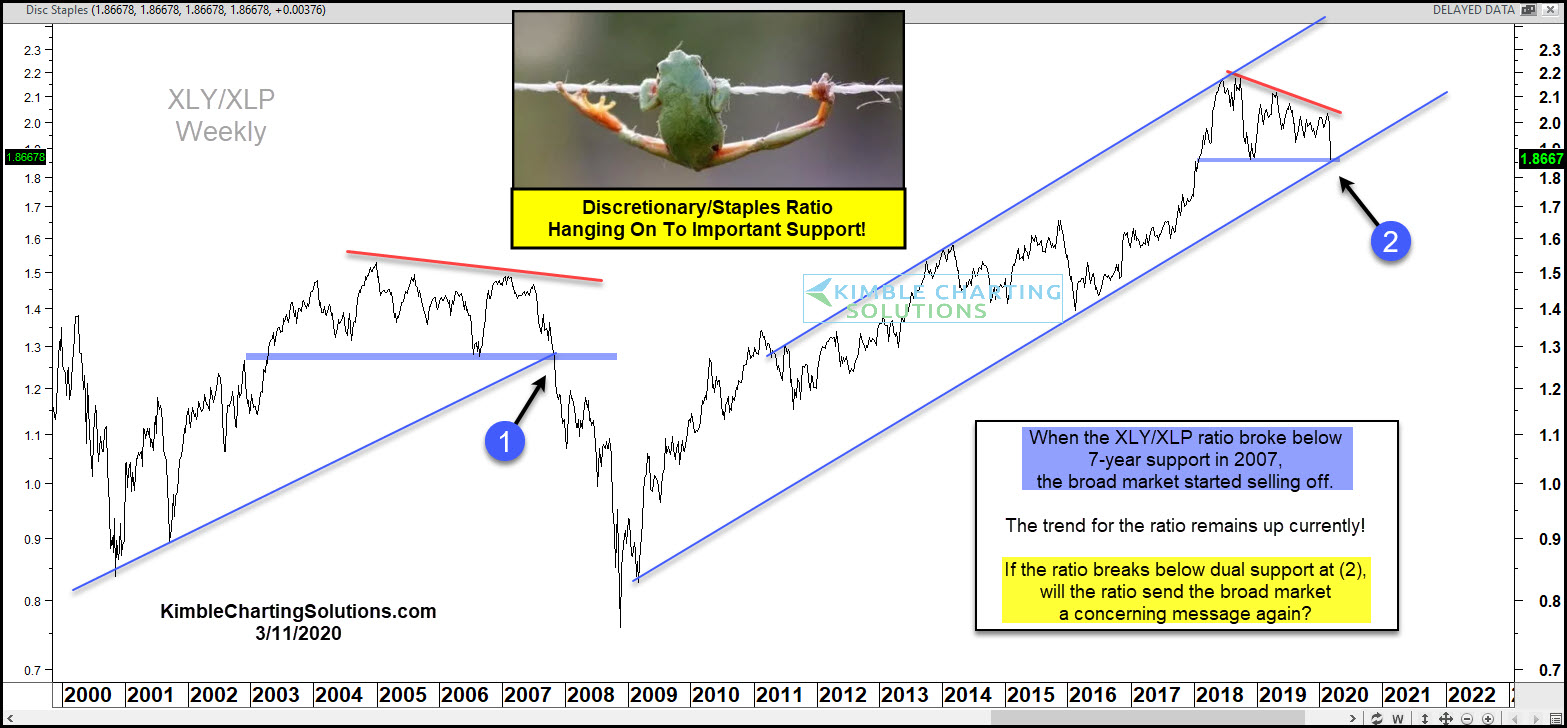
The Corona Virus seems to have people running to the stores to buy large amounts of certain staples (Toliet Paper, Paper Towels, Water).
The chart looks at the Discretionary/Staples (XLY/XLP) ratio over the past 20-years. When investors started selling Discretionary stocks and buying staples in 2007, the ratio turned much lower. When the ratio broke support in 2007, it and the broad markets experienced a good deal of selling pressure.
The ratio trend is currently higher, inside of this long-term rising channel. The weakness of late has the ratio testing dual support at (2).
If the ratio breaks below this dual support zone, it would suggest that staples stocks are of greater interest than discretionary stocks. If this takes place, the ratio would be suggesting that weakness in the broad market could well continue.
Keep a close eye on this important support test at (2), as the current pattern looks very similar to the pattern that took place at the 2007 highs!
The long-term trend for this ratio remains up at this time. The long-term bullish case for stocks wants/needs to see the ratio hang onto current support!
To become a member of Kimble Charting Solutions, click here.