

Courtesy of Chris Kimble
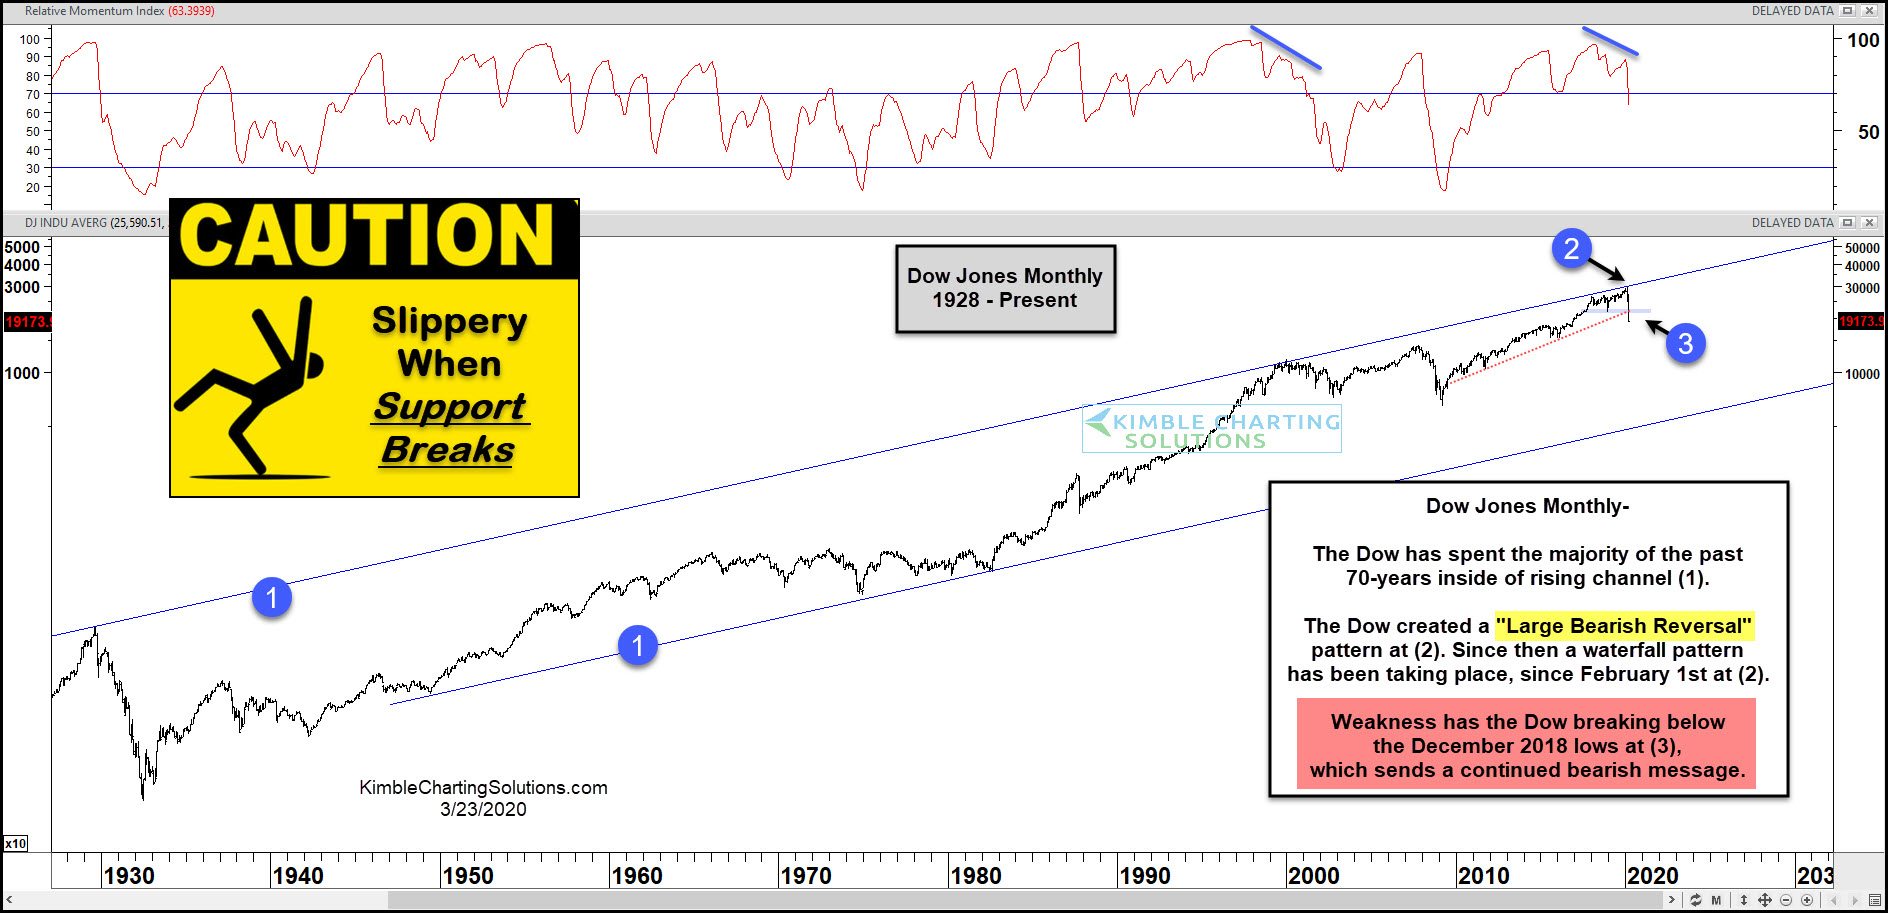
When two support lines break at the same time, the environment can get rather slippery!
This chart looks at the Dow Jones Industrials on a monthly basis since the late 1920s. The Dow has spent the majority of the time since 1950 inside of rising channel (1).
It hit the top of the channel in January at (2), where it created a large bearish reversal pattern while creating a bearish momentum divergence (top chart).
The weakness of late has the Dow breaking below the December of 2018 lows and 9-year rising support at (3).
Knowing the trend is critical, for short-term and long-term investors/traders. Our Global Trends report specializes in trend recognization. In my 40-years of being in the business, understanding the trend and how to take advantage of it critical in these times is extremely important, as fundamentals are very challenging due to the virus.
To become a member of Kimble Charting Solutions, click here.