Courtesy of Chris Kimble
Is an important Tech Index sending a bullish message to investors? It is making an attempt!
Does that mean a low in this important sector is in play? Humbly it is too soon to say at this time!
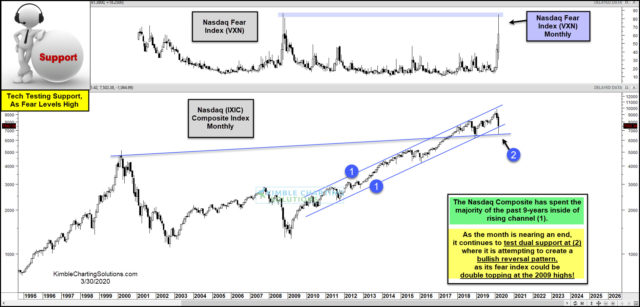
This chart looks at the Nasdaq Composite Index over the past 25-years on a monthly basis.
The index has spent the majority of the past 9-years inside of rising channel (1), as it has created a series of higher lows and higher highs. It created bearish reversal patterns in January & February as it was kissing the underside of the top of the channel and its fear index was near multi-year lows. The index then declined by nearly 30% following these bearish patterns.
The waterfall decline that has taken place the past 60-days has the index attempting to create a large monthly bullish reversal pattern as it tests dual support at (2). At the same time, its fear index is attempting to create a large bearish reversal pattern, as it could be double topping at its 2009 highs.
Keep this in mind, despite the index declining nearly 30% from its highs, its 9-year rising channel remains in play, which for the short-term sends a positive message.
If dual support at (2) is broken to the downside, this index would send a negative message to the broader market and strong selling pressure would take place. At this time, that message has not been sent.
To become a member of Kimble Charting Solutions, click here.


