

Courtesy of Chris Kimble
Commodities prices have been very strong for the past several months. And this has many investors eyeing the prospects of a new wave of inflation and the potential for rising interest rates.
One commodity that has been particularly strong in 2020 is Copper. In fact, Copper has been so strong that it is out-performing the price of gold this year (which is also having a great year!).
But the rally in Copper prices is testing a major price resistance area – We highlighted the multi-month rally (and current price resistance) a couple weeks ago. So what happens if commodities like copper and gold take a breather?
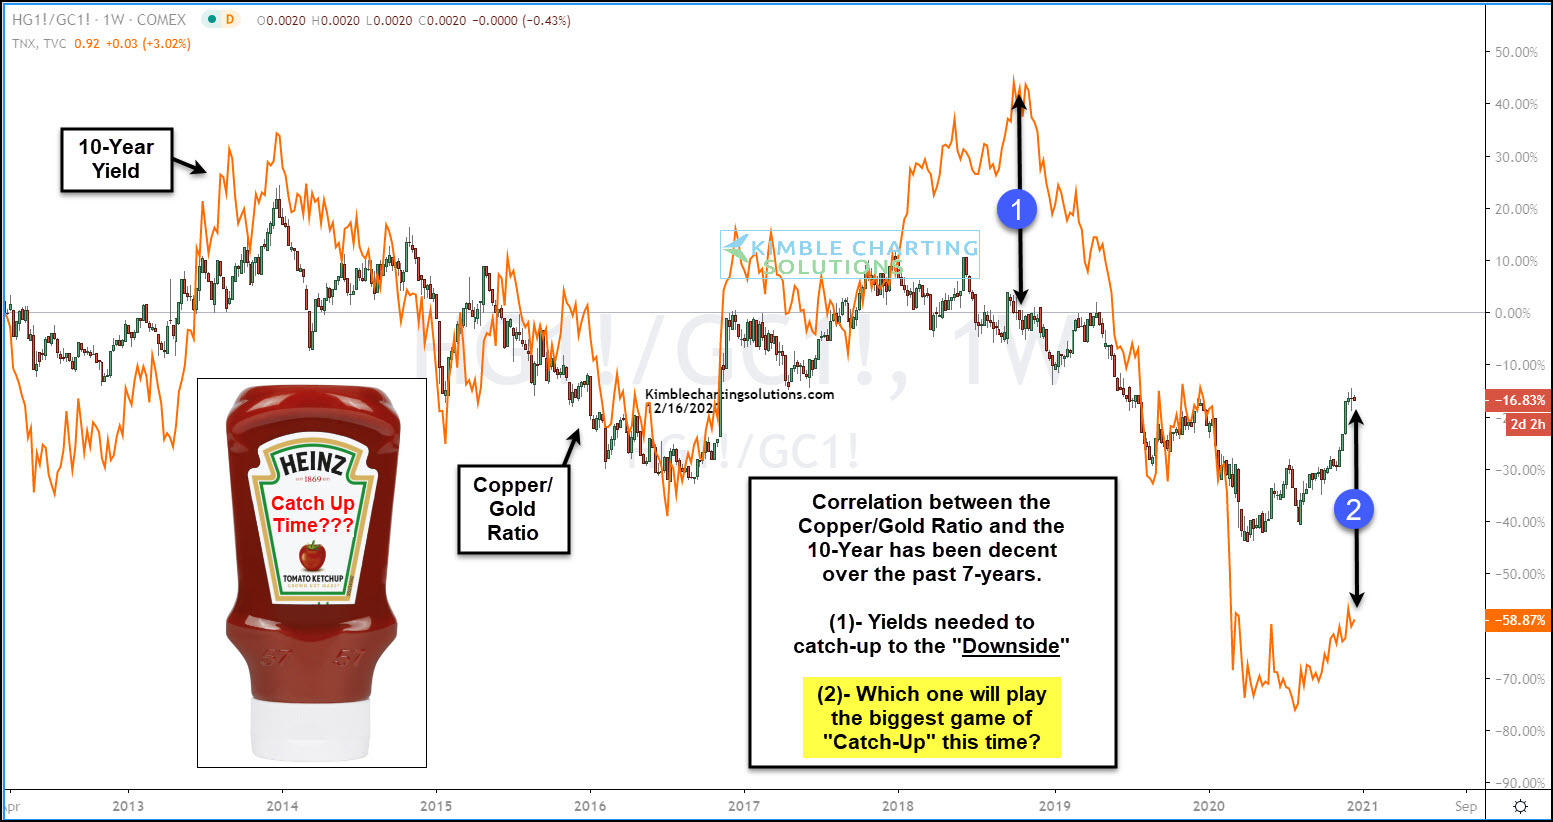
Enter today’s chart, a look at the Copper/Gold price ratio versus 10-year bond yields (i.e. interest rates). The correlation between these two has been decent over the past several years, reverting to the mean whenever one gets too far ahead of the other.
Back in 2018, bond yields were out-performing the Copper/Gold ratio by a wide margin. The ratio ended up reverting to the mean and catching up to the downside at (1). Today we have a similarly wide margin, but the situation is reversed with yields lagging at (2). So, is it time for yields to play catch up?
With Copper testing resistance, there is a chance that the “catch-up” could come from bond yields. And that would mean rising interest rates. Stay tuned!
This article was first written for See It Markets.com. To see the original post CLICK HERE.
To become a member of Kimble Charting Solutions, click here.